|
|
|
|
|
Tax Reform and Outlook for 2018
|
|
Jerry Chafkin
Chief Investment Officer
|
|
|
|
|
It is difficult to form a 2018 outlook for markets without reference to the tax overhaul legislation signed into law at the end of 2017. The implications of the legislation for markets is debatable, and therefore, expectations regarding the implications of the legislation may be as important as the implications themselves, at least in the near term.
Stocks
Stock investors are likely to have a bumpier ride in 2018 than in 2017, as investors try to “true-up” the expected benefit of corporate tax cuts on earnings already built into current prices with actual earnings reports and revised earnings estimates. Nevertheless, there are a number of reasons to believe stocks will continue to rise: positive investor sentiment on the heels of 2017, the global breadth of the current economic expansion, continued earnings growth that is likely to be supplemented with lower corporate tax expense, increased consumer demand, a possible infrastructure bill, the potential for future share buybacks, special dividends and corporate acquisitions to the extent US companies choose to repatriate any of their offshore money.
Volatility
The fact that individual tax cuts will expire after 2025 means that tax policy is almost certain to be revisited. Given that the tax program was passed without bipartisan support, the current tax legislation provides a fragile foundation for companies to use for long-term strategy. For this reason, market expectations regarding its long-term impact on earnings may shift back and forth based on individual corporate announcements (such as repatriating offshore assets or increasing the amount of a company’s regular dividend) as well as forecasts of whether the 2018 US Congressional elections are likely to result in a change in the majority party. Even without tax reform, we will likely see a pickup in volatility in 2018. While realized volatility is slow-moving, it is also considered to be mean-reverting (i.e., when volatility reaches the extremes of its historical range rather than continuing to trend, it tends to reverse course). Median volatility in 2017 was unusually low at 11.1%, well below its longer-term median of 18.0%.1
|
 |
|
The challenge for investors and advisors in the current environment is balancing the opportunity cost of missing out on late-cycle stock market returns against the loss associated with participating in the inevitable market downturn.
|
 |
|
The Dollar
One of the important provisions of the legislation is a low, one-time tax on offshore assets held by US corporations at the time they are repatriated to the U.S. One objective of the provision, beyond revenue realization for the Treasury, was to increase cash available to corporations for incremental investment. If companies were to avail themselves of this opportunity to repatriate earnings currently held offshore, one could imagine it strengthening the dollar relative to other currencies. However, we think a resurgent dollar is unlikely for a few reasons…
However, we think a resurgent dollar is unlikely for a few reasons. The first reason is that it seems unlikely corporations need the cash for capital investment given their access to inexpensive and easy credit. Absent a need for cash, US corporations may opt to keep money offshore to avoid the tax, regardless of the tax rate. Finally, much of the money held offshore by US corporations is already held in dollar-denominated instruments. Without any offsetting pressure from tax reform, we think the dollar is likely to continue to weaken in 2018 due to the same underlying forces observed in 2017: President Trump talking down the dollar, the U.S. withdrawing from trade agreements, and strong economic growth in the Euro Zone.
Interest Rates/Bonds
The market implications of the new tax legislation can only be understood in the context of the current economic/market environment. Despite the rhetoric, 77% of the total tax savings contained in the legislation will go to individuals rather than to corporations.2 The impact of these tax savings for individuals will be the greatest in 2018 and 2019. With more money in their pockets, consumers are likely to increase their spending. Key to understanding the market impact of this stimulus is that the US economy is already fairly strong with pre-existing expectations of the current low unemployment rate continuing to fall, earnings continuing to grow, and US exports picking up. Against this backdrop, the incremental stimulus of individual tax cuts may lead to further upward pressure on wages and prices leading to inflation. Currently, unanticipated inflationary pressure could lead the Fed to raise rates more than currently anticipated by the market. Rising short-term rates are not necessarily bad for bonds so long as inflationary expectations remain low. However, the potential for inflation in the U.S., due to adding stimulus to an already robust economy, coupled with the Fed reducing its bond holdings and the US Treasury issuing more bonds to finance tax cuts (and possibly infrastructure), seems likely to weigh on bond returns in 2018.
While tax cuts usually make municipal bonds less valuable, the capping of the state and local tax deduction may modestly benefit bonds issued by high-tax states and modestly diminish the value of bonds issued by low-tax states.
Sectors
Beyond a popular perception among market commentators that equities will likely outperform bonds in 2018, it is challenging to forecast winners and losers among industries or sectors beyond the generalizations that companies and industries that pay higher than average taxes should benefit more than those that pay lower than average taxes. For example, small-cap stocks may benefit more than large-cap stocks, and the stocks of banks and consumer discretionary companies may benefit more than those in other industries. But, because the breadth of corporate tax changes will mean different things for different companies, a detailed understanding of company-specific factors may be more important than usual, which may give an advantage to active managers in 2018.
Portfolio Positioning
The challenge for investors and their advisors in the current market environment is how to balance the opportunity cost of missing out on late-cycle stock market returns (which historically have been significant), against the loss associated with participating in the inevitable market downturn. Our view remains that valuations tend to not to be a useful tool for market timing, as markets can overshoot fair value on both the upside and the downside for extended periods. We recommend, as we did at the end of Q3 2017, including tactical limit-loss strategies in portfolios as a way of outsourcing decisions to tactically de-risk and re-risk portfolios to disciplined strategies. This advice paid off last quarter with all but one of such strategies returning between 5% and 8%3 while global stocks returned 5.8%4 and US stocks returned 6.6%.5 Looking forward, given the implications of tax reform for different industries and sectors, and the different valuations for various regions, investors may also want to consider including tactical enhanced return strategies in their portfolios. Such strategies are less constrained than core market strategies in their ability to shift among the best performing sectors. This flexibility can be valuable when the dispersion between the sectors and securities is expected to be larger than usual.
Given the likely pressure on fixed income in 2018, investors and their advisors may want to consider bond alternative strategies to complement the interest rate risk in high-quality bond portfolios. While providing similar low-volatility characteristics as bonds, these strategies add credit risk (which tends to be more sensitive to equity prices) and alternative strategies that can take on some equity exposure within a risk-controlled framework.
Managed futures strategies are also worth a second-look for investors who do not already have some exposure in their portfolios. While these strategies are frequently, albeit mistakenly, compared to equities because of their equity-like volatility, managed futures should instead be thought of as a more potent alternative to fixed income for diversifying equity risk. When thought of this way, the perceived value of managed futures strategies can materially change. Using 2017 as an example, managed futures indices returned roughly 1.9%6 – a return below that of both global bond and stock indices (7.4%7 and 24.6%,8 respectively). However, because managed futures offer more efficient diversification of equity risk, they allow some portion of what would otherwise have been allocated to bonds to be allocated to stocks. Thus, for example, a 60/40 stock bond portfolio that shifts 10% of its bond allocation to managed futures, can shift an additional 10% of its bond allocation to stocks without increasing its overall risk profile. In such an example, the 5.5% opportunity cost of investing in managed futures, instead of in global bonds, would be more than offset by the 17.2% incremental return benefit of any incremental allocation to stocks that would have otherwise been in bonds.
|
|
Ask a question about Jerry's update »
|
|
|
|
|
|
2017 Market Update
|
|
Zoë Brunson, CFA
Senior Vice President, Investment Strategies
|
|
|
|
|
The Stars Aligned
Despite the age of the rally and full valuations, the US stock market returned 21.8%9 in 2017. It was a record-making year, not for the level of total return, but because every month saw a positive return – the first time ever for the S&P 500! The surprisingly strong return was supported by a combination of factors including: positive investor sentiment, improving earnings, low volatility, a favorable regulatory environment, share buy-backs, low interest rates, the global nature of the economic expansion, a falling dollar that helped US price-competitiveness, and the passage of tax cuts for individuals and corporations.
Broad Positive Returns
2017 saw positive returns from a wide range of asset classes, styles and sectors. With synchronized global growth and advances, 11 out of 12 asset classes, 9 of 9 US styles, 9 out of 11 US sectors,10 and 42 out of 44 countries,11 all saw positive returns for the year.
Stocks Stand Out
The returns from stock markets dominated those from bonds and other asset classes for the fourth quarter, as well as for the full year. Global equities returned 24.6% for the year and 5.8% in the fourth quarter alone.12
|
|
|
|
It was a record-making year, not for the level of total return, but because every month saw a positive return – the first time ever for the S&P 500!
|
|
|
|
A Risk-On Year
Emerging Markets was the best-performing asset class for both the fourth quarter and the full year 2017, returning 37.8% for the year,13 led by a 54.3% return on Chinese stocks.14 In the U.S., growth styles and sectors were driven higher by the large returns seen in technology, up 38.8% for the year.15 In US bond sectors, credit was the big winner as spreads compressed with high-yield and investment grade returning 7.5%16 and 6.4%17 respectively.
The Dollar Drops
The US dollar declined 9.9% in 201718 and saw its worst year since 2003. But the drop in the dollar was a significant driver of the returns on foreign assets held by US investors, with international stocks returning 27.8%19 and international bonds returning 10.5%20 for the year. In local currency terms, both international stocks and bonds saw returns that were below those seen in the U.S.
No Inflationary Pressure
Long Treasury was the best-performing bond sector for both the full year and for the fourth quarter, returning 8.5% and 2.4% respectively.21 While the Federal Reserve increased rates at the short end, longer-term interest rates fell as inflation expectations remained low.
|
|
Ask a question about Zoë's update »
|
|
|
|
|
|
What Difference Does a Year Make?
|
|
Jason Thomas, Ph.D., CFA
Chief Economist
|
|
|
|
|
The story
Since mid-2015, the Federal Reserve has garnered more attention than a Kardashian at a shopping mall. When would the Fed start raising rates? How fast would it go? Would it kill the fragile economic recovery?
Economists reviewed projections, parsed statements by Fed officials, and generally worked ourselves into a frenzy. For its part, the Fed spent 2016 raising rates by much less than expected and 2017 raising rates by much more than expected. As of January 2018, the Fed has increased the fed funds rate five times in an effort to make financial conditions less supportive of economic expansion.
The reality
Despite all of the Sturm und Drang, broad financial conditions are more expansionary than prior to the first rate increase in 2015! Rising stock prices, smaller credit spreads, a weaker dollar, and unchanged longer-term interest rates are all supportive of near-term economic growth.
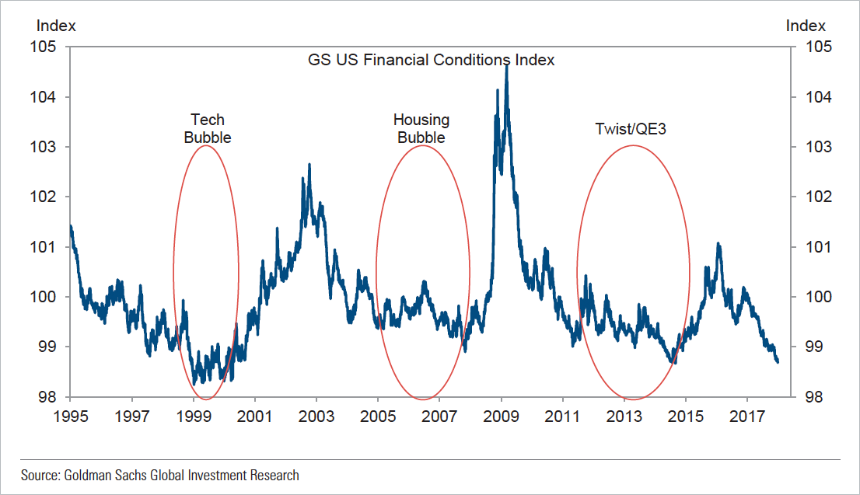
The bottom line
Even with low inflation and limited wage growth in the U.S., the Federal Reserve will likely raise rates three or four times in 2018. And it will likely not matter to global financial markets enjoying a synchronized global economic recovery with low inflation. Goldilocks will be here for another year.
|
|
Ask a question about Jason's update »
|
|
|
|
1 Source: Investing.com
2 Dr. David Kelly, JP Morgan
3 Source: AssetMark
4 Global stocks represented by MSCI ACWI, Source: Morningstar
5 US Stocks represented by S&P 500, Source: Morningstar
6 Managed futures represented by SG Trend Index, Source: Societe Generale
7 Bloomberg Barclays Global Aggregate, Morningstar
8 MSCI ACWI, Morningstar
9 US Market represented by S&P 500, Source: Morningstar
10 FactSet, Morningstar
11 Ned Davis Research
12 Global equities represented by MSCI ACWI Index, source: Morningstar
13 Emerging markets represented by MSCI Emerging Markets Index, source: Morningstar
14 China represented by MSCI China Index, source: Morningstar
15 Technology represented by S&P 500 Technology Index, source: Morningstar
16 High-yield represented by Bloomberg Barclays Corporate High Yield Index, source: Morningstar
17 Investment grade represented by Bloomberg Barclays Corporate Investment Grade Index, source: Morningstar
18 US Dollar Index (DXY), source: FactSet
19 International stocks represented by MSCI EAFE, source: Morningstar
20 International bonds represented by Bloomberg Barclays Global Aggregate ex USD, source: Morningstar
21 Long Treasuries represented by Bloomberg Barclays Treasury Long, source: Morningstar
|
| Asset Class |
Index |
Description |
| US Equities |
S&P 500 |
A cap-weighted index that is generally considered representative of the US equity market, consisting of 500 leading companies in leading industries of the US Market capitalizations are generally above $5 billion representing approximately 80% of available market capitalization. |
| Global Equities |
MSCI ACWI |
A free float-adjusted capitalization weighted index that is designed to measure the equity performance of countries considered to represent both developed and emerging markets. |
| International Developed Equity |
MSCI EAFE |
A free float-adjusted market capitalization weighted index that is designed to measure the equity market performance of countries considered to represent developed markets, excluding the U.S. and Canada. |
| Emerging Markets Equity |
MSCI Emerging Markets |
A free float-adjusted market capitalization index that is designed to measure the equity market performance of countries considered to represent emerging markets. |
| China Equity |
MSCI China |
The MSCI China Index captures large and mid-cap representation across China H shares, B shares, Red chips, P chips and foreign listings (e.g. ADRs). With 152 constituents, the index covers about 85% of this China equity universe. |
| US Technology Equities |
S&P 500 Sector Technology Index |
The index is primarily composed of companies involved in technology hardware, storage, and peripherals; software; communications equipment; semiconductors and semiconductor equipment; internet software and services; IT services; electronic equipment, instruments and components. |
| US Bonds |
Bloomberg Barclays US Aggregate |
The index covers the USD-denominated, investment-grade, fixed-rate, taxable bond market of SEC-registered securities. The index includes bonds from the Treasury, Government-Related, Corporate, MBS (agency fixed-rate and hybrid ARM pass-throughs), ABS, and CMBS sectors. US Agency Hybrid Adjustable Rate Mortgage (ARM) securities were added to the US Aggregate Index on April 1, 2007. |
| US High Yield |
Bloomberg Barclays US Corporate High Yield |
The index measures the market of USD-denominated, non-investment grade, fixed-rate, taxable corporate bonds. Securities are classified as high yield if the middle rating of Moody’s, Fitch, and S&P is Ba1/BB+/BB+ or below. The index excludes emerging market debt. |
|
|
This report is for informational purposes only, and is not a solicitation, and should not be considered investment advice. The information in this report has been drawn from sources AssetMark believes to be reliable, but its accuracy is not guaranteed, and is subject to change. Investors seeking more information should contact their financial advisor. Financial advisors may seek more information by contacting AssetMark at 800-664-5345.
Investing involves risk, including the possible loss of principal. Past performance does not guarantee future results. Asset allocation cannot eliminate the risk of fluctuating prices and uncertain returns. There is no guarantee that a diversified portfolio will outperform a non-diversified portfolio in any given market environment. No investment strategy, such as asset allocation, can guarantee a profit or protect against loss in periods of declining values. It is not possible to invest directly in an index.
Investments in mutual funds and exchange traded funds that hold equities, bonds, and other securities can decline significantly in response to adverse market conditions, company-specific events, changes in exchange rates, and domestic, international, economic, and political developments. Investments in bonds and fixed income related securities also involves market and interest rate risk (prices can decline, if interest rates increase), and default risk (an issuer being unable to repay principal and interest). High-yield bonds are generally subject to greater risk of default and volatility, than investment-grade bonds. Real estate investments are subject to credit and market risks, typically based on changes in interest rates and varied economic conditions. Investing in alternative investments, including managed futures, commodities, and currencies is not appropriate for all persons, as the risk of loss is substantial. Investments in futures involve market, counterparty, leverage, liquidity, interest rate, foreign currency, commodity, volatility, and other risks.
For more complete information about the various investment solutions available, including the investment objectives, risks and fees, please refer to the Disclosure Brochure and applicable Fund Prospectus. Please read them carefully before investing. For a copy, please visit www.assetmark.com, or contact your AssetMark Consultant or Financial Advisor.
CFA® and Chartered Financial Analyst® are registered trademarks owned by CFA Institute.
AssetMark, Inc. is an investment adviser registered with the Securities and Exchange Commission.
©2018 AssetMark, Inc. All rights reserved.
|
|
|
|
|
|
|
C32699 | 01/2018 | EXP 03/31/2019
1014-2869 ADV
|
|
|
|