|
Having acknowledged these sources of investor concern, it is worth pointing out that each was relatively short-lived. Fears of a broad-based trade war quickly receded as it became clear that tariffs would target China. Facebook had several days of sharp price declines but seemed to stabilize as the market decided that with 2 billion users it could lose tens of thousands of them without materially impacting earnings (especially given that users in its business model are closer to being the product than to being the customer). Finally, the markets seemed to incorporate relatively quickly the Fed’s signaling of a multi-year series of gradual rate hikes before stabilizing with bond yields even pulling back slightly from their high. Given the current low level of interest rates and the Fed’s expected pace of tightening, rates are unlikely to become restrictive for stocks anytime this year or next and money supply is still growing. While each of these events dominated the news for several days, none seemed enough to offset the fundamentally supportive environment for corporate earnings.
Although no one can be sure what triggered the stock market sell-off in February (maybe momentum or short volatility strategies), the magnitude of the drop in the S&P 500 from its high to its low for the quarter was hardly unusual in the context of history.
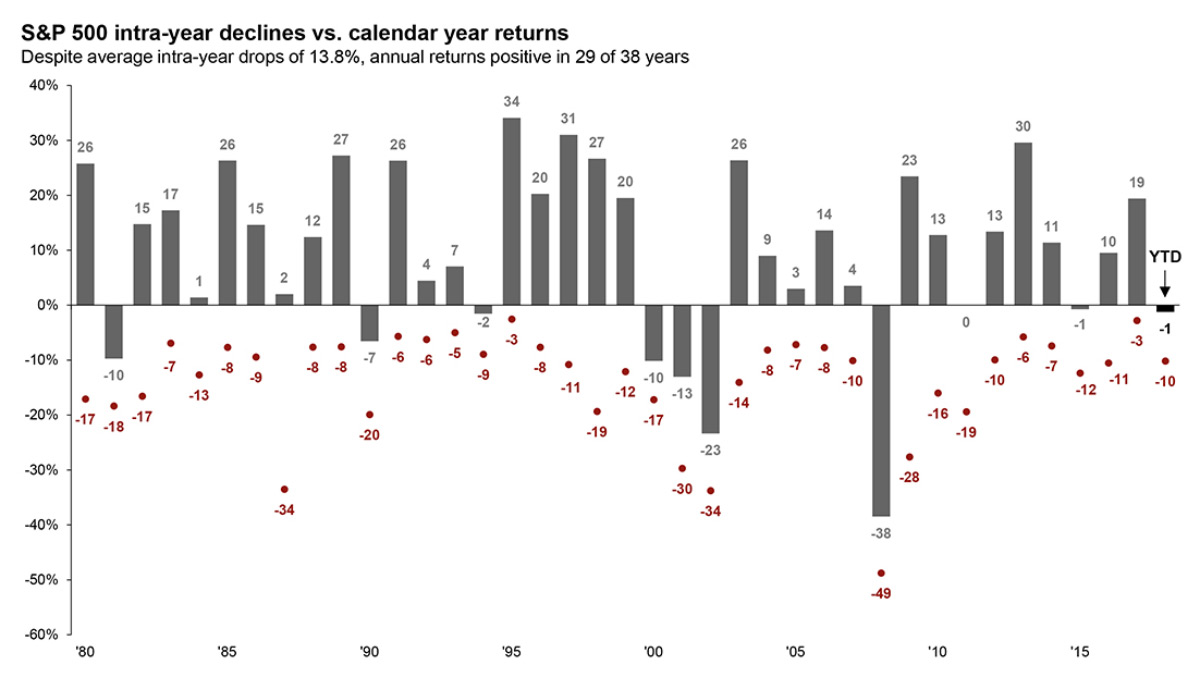
Source: JP Morgan
Regardless of the increase in volatility from its lows, our optimism about stock prices stems from a strong story about the economy and earnings that remains mostly unchanged from prior quarters. Earnings growth continues to be positive, thanks to the tax cuts at the end of 2017 which had a big impact on after tax profitability. Positive earnings revisions have been reported for an unusually high percentage of US stocks. Valuations may be relatively high on a trailing basis relative to the historical average but if analyst forecasts are correct, forward price-earnings multiples are not stretched and are roughly in line with their historical average.
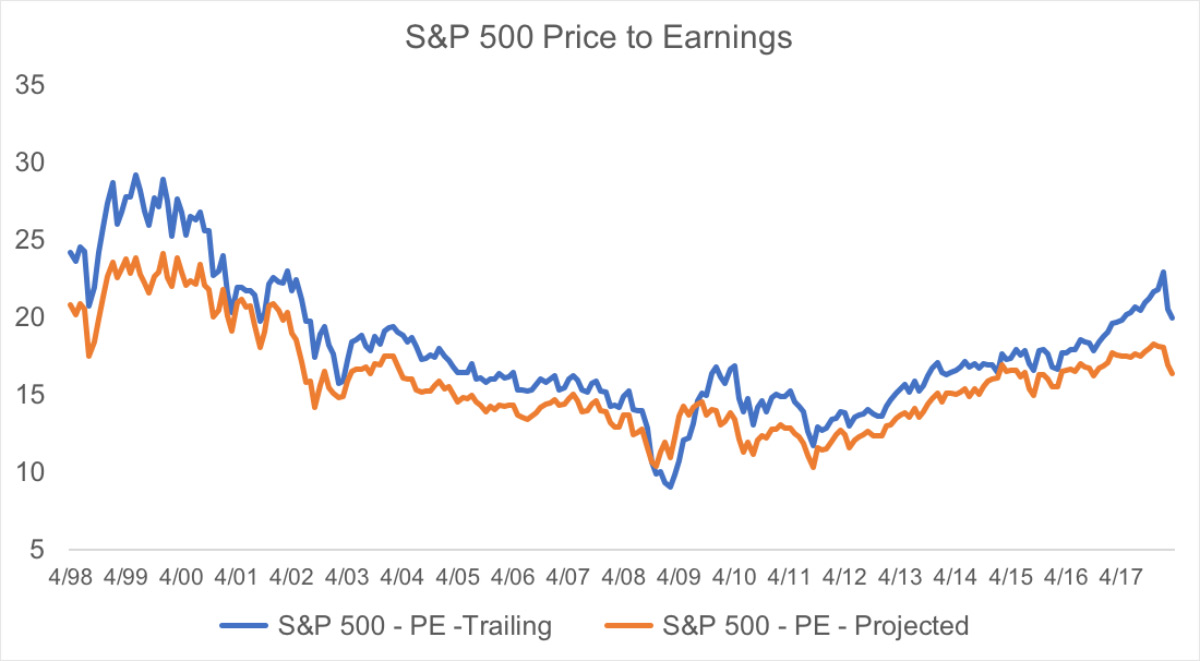
Source: FactSet
Finally, while its valuable to keep in mind that the stock market generally leads the economy, the economy, as represented by the Conference Board’s US Leading Economic Indicators Index, does not suggest we are anywhere close to Recession. When the index growth rate is negative we are in a recession. In contrast, February’s data showed the annual growth rate rose to 6.5% (which is among the highest growth rates in the last decade).
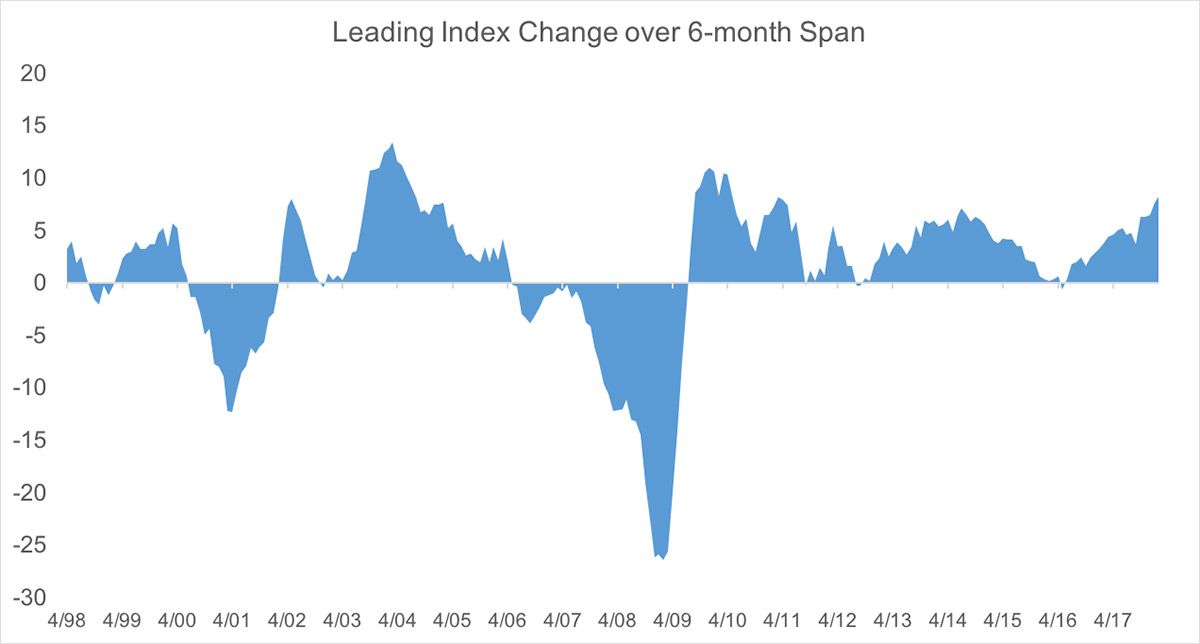
Source: FactSet
Potential for volatility
After April’s earnings reports are in, and even if they confirm continued growth in corporate earnings, we anticipate continued bouts of market volatility for three reasons.
The first reason is that 2018 is a mid-term elections year. Historically, the stock market can struggle in the 2nd and 3rd quarter of mid-term election years, as investors try to forecast whether control of the House or Senate will change, creating uncertainty on everything from regulations, to taxes, to spending to trade. It is probably for this reason, that mid-term year generally has the lowest, or close to the lowest, median return for the stock market in the presidential cycle. Historically, however the market tends to recover in the fourth quarter as greater certainty emerges over the likely outcome of the election. While the fiscal stimulus of tax cuts makes this year very different from the typical mid-term year which is often characterized by fiscal tightening, the uncertainty that accompanies elections is generally something that gives rise to volatility.
The second reason is that we are probably looking at a multi-year series of 7 or 8 interest rate increases into 2020. Before and after each meeting of the Federal Open Market Committee, we should expect the market to fret about whether the Federal Reserve (the Fed) has miscalculated and will be moving too quickly and slowing growth or whether it is moving too slowly letting the economy overheat ultimately forcing it to move too quickly and potentially triggering a recession.
Finally, the potential for an escalating or broadening trade war, concerns about potential geopolitical conflict, and unanticipated or inadequately-specified policy statements by officials will sporadically generate uncertainty for investors.
Outlook for interest rates
While some might argue that bonds are currently oversold, we believe that pressure on bond prices from the Fed’s plan to gradually raise the discount rate over the next several years will almost certainly be a headwind. The Fed seems to be working hard to raise rates only very gradually and to telegraph its intentions well in advance in order not to surprise the market.
While always tricky to cool the economy without triggering a recession, the Fed may have little choice but to try thanks to the off-cycle introduction by the US Congress of the twin fiscal stimuli of tax cuts and a $1.3 trillion spending bill when unemployment was already low and earnings growing.
There are more risks to bonds than just the Fed. Although President Trump’s initial comments on broad-based tariffs on steel and aluminum imports have been scaled back to focus on China, China is nevertheless one of our three largest export markets for goods and will likely retaliate. But China is hardly an exception to this administration’s antagonism toward global free trade agreements. We should remember that on his first day in office, President Trump abandoned the Trans Pacific Partnership trade pact and regularly threatens NAFTA even as the U.S. is engaged in extended renegotiations with Mexico and Canada. While Trump’s initial rhetoric on issues (which is often aimed at pleasing his base) can sometimes differ in important ways from his ultimate policy decisions, his “devaluation” of trade can potentially lead to a devaluation of bonds through several different mechanisms: 1) the cost of tariffs ultimately gets passed on to consumers through higher prices of imported goods or domestic substitutes potentially creating price inflation; 2) uncertainty surrounding trade can translate into greater uncertainty for the economy driving a higher term premium and higher yields for bonds; 3) the flip-side of our trade deficit is a large financial account surplus (e.g., China owns 8% of our U.S. Treasury debt) foreign disinvestment of those assets (albeit unlikely without more serious provocation) would put upward pressure on yields; and finally 4) the unfortunate timing of potential tariff-based inflation, reduced foreign demand for our debt, and a higher term premium that coincides with higher debt issuance by the U.S. government (since the U.S. has chosen to finance its budget increases through increased debt instead of increased taxes).
Positioning
Even though we believe stocks continue to offer the best opportunities over the next 12 months, the countervailing pressures of tax cuts and business-friendly policies on one side and uncertainty from trade policy, mid-term elections, and monetary policy on the other means well-diversified portfolios continue to be recommended.
Several advisors have shared stories of investors who feel that their negative return for the quarter (despite negative returns across most asset classes and strategies) means that diversification is not working. While tempting to dismiss such skepticism given the number of instances in history when diversification has helped and the inadequacy of a three-month time period to evaluate the performance of any strategy, there are nevertheless several important points to highlight with such investors. The first is the objective of diversification is not to never lose money, but to lessen the magnitude of the short-term gains and losses associated with a long-term investment program. And, while the S&P 500 had a return of -0.76% for the first quarter, the value of a 60/40 global portfolio of stocks and bonds was essentially unchanged over the same time period.3
Investors disappointed by negative returns across most asset classes and strategies should also be reminded that attractive long-term returns are not earned smoothly over time. They are earned through a series of moderate gains occasionally interrupted by a large loss or a series of small losses such that the long-term return is positive. This is the power of compounding. Investors frustrated by the broad-based losses and lack of opportunity during the quarter should be reminded a 60/40 global stock/bond portfolio returned roughly 12% for the trailing twelve months ending March 29.4
Beyond diversifying across assets classes, regions and sectors, we generally recommend investors also diversify across strategies, including managed futures, tactical equity, and bond alternatives. For the most part these strategies also had negative returns for the first quarter. The trend-following signals underlying managed futures strategies suffer when long-term trends reverse (e.g., the steady climb in stocks and foreign currencies throughout 2017 that reversed in February 2018) or struggle to get established. Tactical limit loss strategies are equity strategies and will generally behave just like traditional equity funds during small and moderate stock market pullbacks or corrections. The value of including them in a portfolio is to supplement an investor's exposure to the stock market most of the time but without also increasing the “tail-risk” or most extreme declines in portfolio value attributable to extended bear markets in stocks. Given that our twelve-month outlook for stocks remains positive or at least more attractive than that for bonds, we still feel strongly about the role for such strategies in a well-diversified portfolio. Similarly, bond alternatives are generally strategies that, like bonds, are characterized by relatively low volatility but which have the flexibility to take on credit or equity-related risk in addition to interest rate risk.
As we have seen, different strategies and different asset classes can have unrelated return drivers and distinct patterns of return and on occasion still all have a period of negative returns. We don’t know how or when the most recent rally ends. But for investors who think it may end with a whimper rather than a bang – rising rates weighing on bond returns, conflicted market sentiment frustrating clear trends, and positive but anemic returns for stocks – we have not offered a strategy with a return pattern that could deliver attractive returns in such a scenario. The only types of strategies that have the potential to stand out in such an environment are option-writing strategies that benefit from higher premium income associated with higher volatility so long as stocks prices are relatively flat or rising slowly. We will be adding a fund based on such a strategy to our platform in May. Having said this, no strategy offers a “free lunch” and option writing is not for everyone, but it may be worth considering a small allocation as a low volatility alternative to bonds.
While we discourage short-term trading based on emotion or return chasing, we would expect strategies with a stock tilt to emerging markets (due to their relatively more attractive valuations), and a bond tilt to global credit (due to lower sensitivity to rising US rates) to be among better performing strategists.
While difficult to maintain one’s investment discipline during periods when the market’s apprehension about what comes next feels so clear, it is important to remember that 2017 was a truly remarkable period of consistently positive returns month after month. It was disconcerting to investors when February’s drop woke them from this dream of how they wish investing would always work. Now that we are awake, we must remind ourselves how investing more typically works with alternating periods of gains and losses. While we don’t think the bull market is over yet, volatility is back to more typical levels. Political drama and presidential tweets aside, this – not 2017 – is what “normal” feels like. While we believe the market environment remains positive in the intermediate term (primarily due to the ongoing impact of tax cuts), stocks may nevertheless drift lower in the near term before coming back. Diversification across asset classes, regions, and strategies remains the best, albeit imperfect, way for advisors to help their clients stay disciplined in order to realize the benefits of a long-term investment strategy.
|