|
|
|
|
|
Update: Turning the “inversion” story upside down.
|
|
Jason Thomas, Ph.D., CFA
Chief Economist
AssetMark, Inc.
|
|
|
|
|
An earlier version of this communication was published on April 3, 2019.
The story
On March 22, 2019, the yield curve “inverted” (short-term rates higher than long-term rates) for the first time since 2007. Most of the time, bond investors demand additional yield to bear the increased risk of bonds with a longer maturity, leading to an upward sloping yield curve. But as the economy moves later in the cycle and the Fed increases rates to prevent the economy from overheating, the yield curve has tended to flatten. Yield curve inversion has preceded the last 7 recessions, leading to concerns that the March inversion indicates that that economy is headed for recession.
Historical Yield Curve Spreads
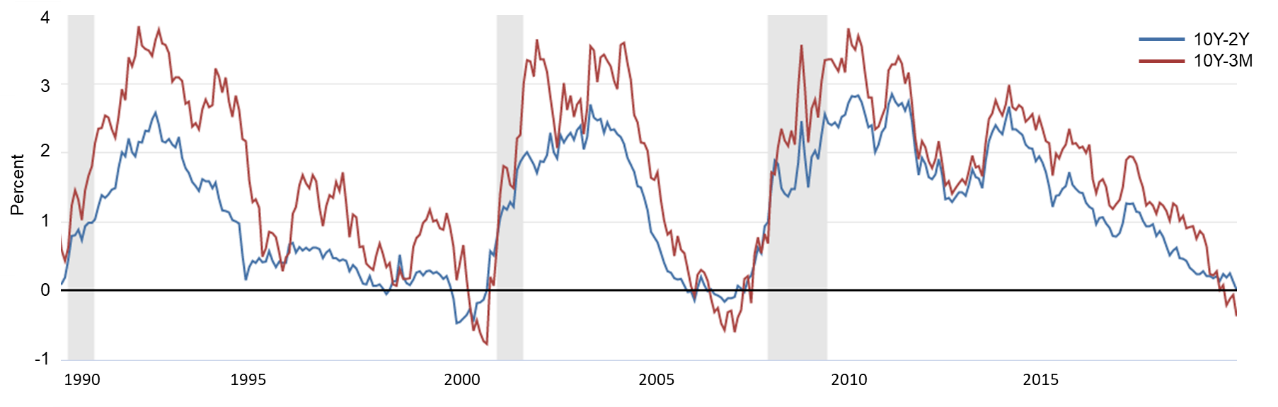
As of 8/14/19. Shaded areas represent recessions. Source: Federal Reserve Bank.
Since March, the inversion has continued, limited to the very short maturities. Yesterday morning (August 14, 2019), the 10-year yield briefly fell below the 2-year yield as well, before closing the day at a slight premium.
Yield Curve
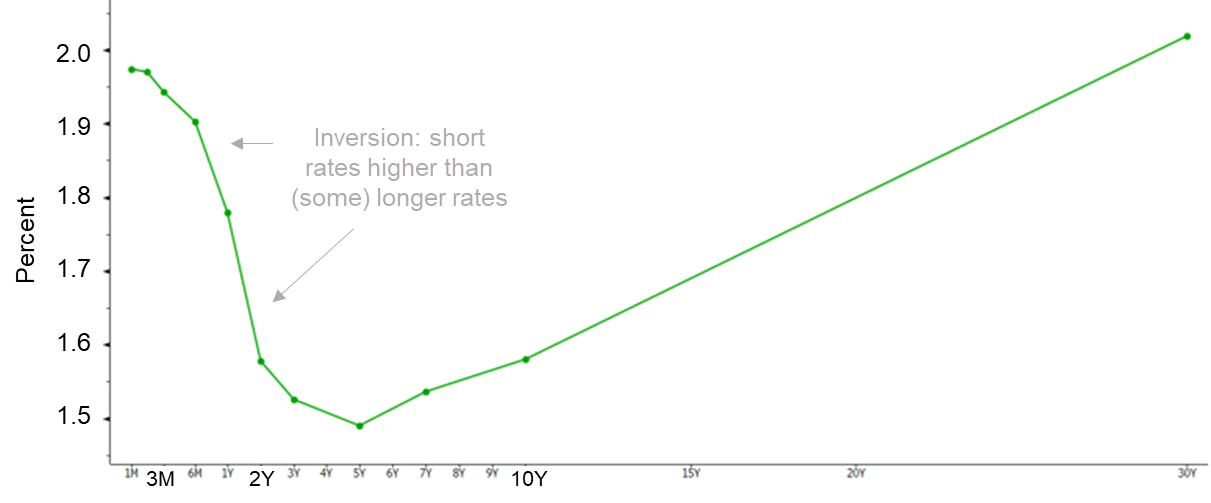
As of 8/14/19. Source: Bloomberg.
The US equity market seemed to interpret the 10-year / 2-year inversion as an even stronger sign of an imminent recession.
The reality
The yield curve is not an independent measure of the economy or even a pure expression of investors’ expectations about the future – strictly speaking, it is a function of the current supply (for sale) of, and the demand for, government bonds. The buying and selling reflects monetary policy (driving short maturities) and expectations about the future (driving longer maturities).
In each of the episodes of curve inversions since the late 70’s, the inversion was driven by short-term rates rising faster than long-term rates. For example, in the 3 months prior to the last 10-year / 2-year inversion in December 2005, the 2 and 10-year yields rose by 24 basis points and 7 basis points respectively. Note that the economic recession officially began in December 2007, several years after the initial inversion. As shown above, the yield curve was no longer inverted.
The current inversion has been driven by falling long-term rates rather than rising short-term rates. Since mid-May 2019, the 2-year yield has fallen by 62 basis points while the 10-year yield has fallen by 83 basis points. The absence of tightening monetary policy suggests that the yield curve inversion is a less compelling indicator of a near-term recession this time around.
Change in Yields Over 3 Months Prior to Inversion
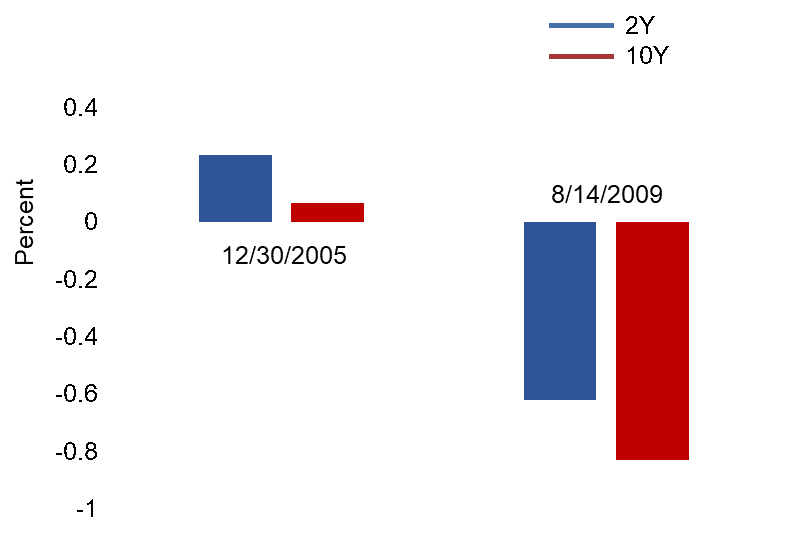
Dates represent initial inversion of 10Y-2Y yields. As of 8/14/19. Source: Bloomberg, AssetMark calculations.
The bottom line
Financial advisors are right to look to current economic variables for clues about the future. And rules of thumb can be very helpful. But the full story is typically found one or two layers beneath the media headlines.
The timing of the next recession is unknowable. But we do not see any evidence in current financial conditions to suggest that investors should abandon a growth-oriented approach, if appropriate given their financial plan.
|
|
See More Views on Today’s Markets
Ask a question about Jason's update
|
|
|
| Index |
Description |
| Bloomberg Barclays Emerging Markets USD Aggregate |
The index is a flagship hard currency Emergency Markets debt benchmark that includes fixed and floating-rate US dollar-denominated debt issued from sovereign, quasi-sovereign, and corporate EM issuers. Country eligibility and classification as Emerging Markets is rules-based and reviewed annually using World Bank income group and International Monetary Fund (IMF) country classification. |
| Bloomberg Barclays Global Aggregate |
The index is a measure of global investment grade debt from twenty-four local currency markets. This multi-currency benchmark includes treasury, government-related, corporate and securitized fixed-rate bonds from both developed and emerging markets issuers. The index also includes Eurodollar, Euro-Yen, and 144A Index-eligible securities, and debt from five local currency markets not tracked by the regional aggregate benchmarks (CLP, MXN, ZAR, ILS and TRY). |
| Bloomberg Barclays Global Aggregate ex USD |
The index is a measure of global investment grade debt from twenty-three local currency markets. This multi-currency benchmark includes government-related, corporate and securitized fixed-rate bonds from both developed and emerging markets issuers. The index also includes Eurodollar, Euro-Yen, and 144A Index-eligible securities, and debt from five local currency markets not tracked by the regional aggregate benchmarks (CLP, MXN, ZAR, ILS and TRY). |
| Bloomberg Barclays Global Aggregate ex USD Hedged |
The index is a measure of global investment grade debt from twenty-three local currency markets. This multi-currency benchmark includes government-related, corporate and securitized fixed-rate bonds from both developed and emerging markets issuers. The index also includes Eurodollar, Euro-Yen, and 144A Index-eligible securities, and debt from five local currency markets not tracked by the regional aggregate benchmarks (CLP, MXN, ZAR, ILS and TRY) hedged against the USD. |
| Bloomberg Barclays US Agency |
Measures the performance of the agency sector of the US government bond market and is compromised of investment-grade native currency US Dollar-denominated debentures issued by government and government-related agencies, including the Federal National Mortgage Association (“FNMA” or “Fannie Mae”). The index includes both callable and non-callable agency securities that are publicly-issued by US Government agencies, quasi-federal corporations, and corporate and foreign debt guaranteed by the US government. |
| Bloomberg Barclays US Corporate High Yield |
The index measures the market of USD-denominated, non-investment grade, fixed-rate, taxable corporate bonds. Securities are classified as high yield if the middle rating of Moody’s, Fitch, and S&P is Ba1/BB+/BB+ or below. The index excludes emerging market debt. |
| Bloomberg Barclays US Treasury 1-3 Year |
The index measures the performance of short-term government bonds issued by the U.S. Treasury. It includes all publicly issued, U.S. Treasury securities that have a remaining maturity of between 1 and 3 years, are non-convertible, are denominated in U.S. dollars, are rated investment grade, are fixed rate, and have $250 million or more of outstanding face value. |
| Bloomberg Barclays US Treasury Long |
The index measures the performance of long-term government bonds issued by the U.S. Treasury. It includes all publicly issued, U.S. Treasury securities that have a remaining maturity of 10 or more years, are non-convertible, are denominated in U.S. dollars, are rated investment grade, are fixed rate, and have $250 million or more of outstanding face value. |
| Dow Jones Global Select REIT |
A broad measure of the performance of publicly traded International real estate securities, such as Real Estate Investment Trusts (REITs) and Real Estate Operating Companies. |
| MSCI ACWI |
A free float-adjusted capitalization weighted index that is designed to measure the equity performance of countries considered to represent both developed and emerging markets. |
| MSCI China |
The MSCI China Index captures large and mid-cap representation across China H shares, B shares, Red chips, P chips and foreign listings (e.g. ADRs). With 152 constituents, the index covers about 85% of this China equity universe. |
| MSCI EAFE |
A free float-adjusted market capitalization weighted index that is designed to measure the equity market performance of countries considered to represent developed markets, excluding the U.S. and Canada. |
| MSCI Emerging Markets |
A free float-adjusted market capitalization index that is designed to measure the equity market performance of countries considered to represent emerging markets. |
| S&P 500 |
A cap-weighted index that is generally considered representative of the U.S. equity market, consisting of 500 leading companies in leading industries of the U.S. Market capitalizations are generally above $5 billion representing approximately 80% of available market capitalization. |
| S&P 500 Sector Healthcare |
The index is primarily comprised of companies involved in health care equipment and supplies, health care providers and services, biotechnology, and pharmaceuticals industries. |
| S&P 500 Sector Information Technology |
The index is primarily composed of companies involved in technology hardware, storage, and peripherals; software; communications equipment; semiconductors and semiconductor equipment; internet software and services; IT services; electronic equipment, instruments and components. |
|
|
|
|
|
|
|
C19-0168 | 08/2019 | EXP 08/31/2020
748745-9273 ADV
|
|
|
|