|
Executive Summary
- Investors this quarter were faced with navigating the crosscurrents of easier monetary policy, slowing growth, rising core inflation and on-again, off-again trade tensions with China. In this environment, bonds outperformed stocks for the quarter as interest rates fell globally. Given falling interest rates, both stocks and bonds have performed well year-to-date1, presenting investors an atypical investing environment.
- Unconventional monetary policy in Europe and Japan has led to a peak of $17 trillion of global debt trading with a negative yield2. Negative rates have weakened foreign currency and led to a US-dollar rally. Negative yields abroad are partly to blame for the inverted yield curve in the U.S. and provide support for stocks globally.
- Despite a barrage of news articles about the inverted yield curve, record amounts of US corporate debt3, an impeachment inquiry and trade tensions, leading economic indicators and cyclical sectors for the US economy are generally healthy and, when combined with the fiscal stimulus of a trillion-dollar budget deficit, corporate earnings and stock prices should continue to grow, albeit slowly this year.
- Given the risks and uncertainties, now is not the time to try to maximize returns by extrapolating recent trends into the future. Instead, investors should emphasize protecting capital by broadly diversifying across asset classes and strategies, even those that may have underperformed over the past decade.
Market Environment
Crosscurrents have emerged in the outlook for growth, as global economic data is generally healthy but continues to send mixed messages. Services and consumption remain bright spots, even as manufacturing has weakened due to trade tensions. Concerns about slower economic growth have led the Federal Reserve (Fed) to cut short-term interest rates. Central banks in China and Europe have also shifted monetary policy toward stimulus. An imminent recession in the U.S. seems unlikely, given that the data points to a continued, but slower, expansion.
Source: Bloomberg
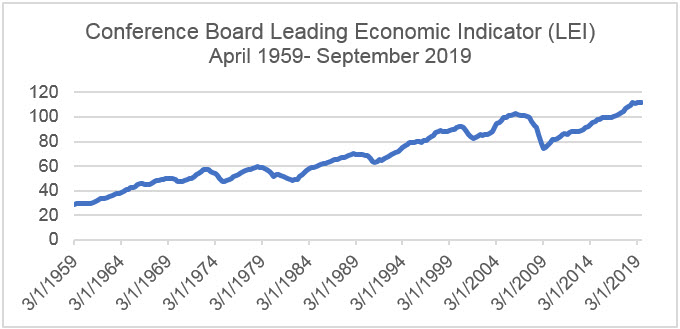
Let’s consider three data points. First, the Leading Economic Index (LEI) points to a continued economic expansion in 2019, albeit at a slower pace. The index is designed to predict future movements in the economy based on a composite of 10 economic indicators (e.g., building permits, unemployment claims, new manufacturing orders, stock prices and interest rate spreads).
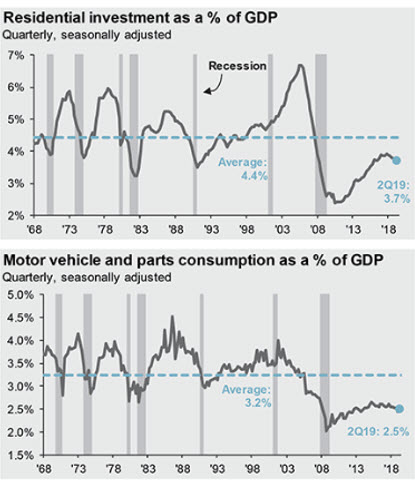
Second, it’s not just LEIs that hold out hope for our continuing economic expansion, even if more slowly than in the past. Cyclical sectors of our economy, like home construction and auto sales, remain healthy. These sectors, which have historically helped explain expansions and recessions, are not showing the excesses or bubble characteristics that often precede a recession.
Source: JP Morgan Guide to the Markets, September 30, 2019
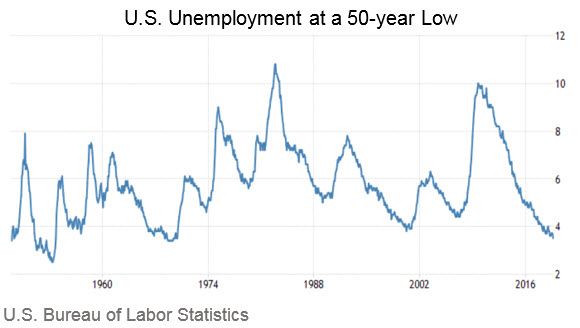
Finally, although the global economy is slowing, the US economy is less sensitive to (but not immune to) weaker global demand than foreign economies that may be more dependent on exports. More than 70% of US economic production is fueled by domestic consumption, which is good given the current 50-year historically-low unemployment rate, rising wages and positive consumer sentiment. If unemployment stays low and the job market remains robust, consumers are likely to remain confident and spend. Combine this “self-propelled” economy with the fiscal stimulus of a trillion-dollar US budget deficit and the outlook for the US expansion continuing— at least in the near-term — looks likely.
To be clear, this hardly means that the economy faces smooth sailing but rather that the slow-but steady-expansion, that recently entered a record 11th year, could carry on for the foreseeable future led by consumers, easy monetary policy, and fiscal stimulus.
Global stocks and the US dollar
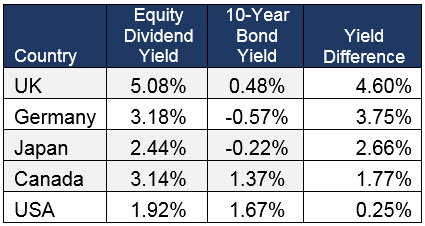
It was a volatile quarter in the markets as investors faced a flurry of developments relating to trade, global monetary policy, and politics. The S&P 500 ended modestly higher for the quarter, up 1.7%4, and consumer confidence has been improving steadily. The European Central Bank has also embarked on additional stimulus to boost growth. This alone could prove supportive of developed international stocks. The strong dollar has provided a big headwind and detracted from returns on international investments held by US investors. With the Fed’s recent cuts in interest rates, the strength of the US dollar could slow—or even reverse—increasing the potential appeal of international stocks ahead. Global equities remain attractive in part due to the growing appeal of the dividends relative to bond yields. Equity dividend yields in the U.S. and Europe are higher than their respective 10-year government bond yields, positioning stocks as an attractive alternative to bonds for income-seeking investors. The dividend yield on the S&P 500 now exceeds 10-year Treasury yield by 0.25%. The dividend yield on German equities represents a remarkable 3.75% premium to the negative yields on German government 10-year bonds.
Source: Bloomberg. Data as of 9/30/19
Potentially offsetting the tailwinds supporting stock markets is the absence of clearly and consistently articulated US government policies, which creates uncertainty for investors that the market tries to fill by interpreting the most recent news report or presidential tweet. This can result in highly variable levels of volatility for US stocks, over relatively short periods of time, that can make investors uncertain and therefore anxious. While volatility seems elevated, a historical perspective shows it remains within the long-term average of 20%5.
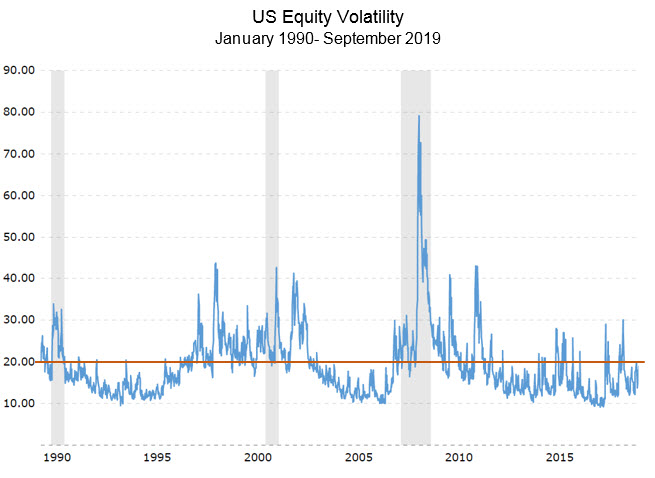
Source: CME Group, Capital Group
The most recent source may be daily developments relating to the US House of Representatives’ impeachment inquiry. To date, equity markets have largely shrugged off the impeachment inquiry, but we are in the early innings of this process. History, while offering limited evidence, has shown that markets are more focused on the economic environment than on the political landscape of presidential impeachments. The S&P 500 fell 26%6 between President Nixon’s impeachment inquiry and his resignation. However, that decline also coincided with an economic recession and the oil crisis. President Clinton’s impeachment did little to slow the S&P 500, which gained over 27% between the impeachment inquiry and his acquittal7.
Interest Rates
The volatility in the quarter wasn’t limited to stocks. Government-bond yields in the U.S. tumbled in August, with the 30-year Treasury yield touching a record low of 1.94% as investors bid up the price of safe-haven assets. Investors who have not been watching interest rates closely may lose sight that up until the beginning of the year, the Fed had been raising short-term interest rates. The yield on the 10-year Treasury note topped 3%8. Starting in July 2019, the Fed cut interest rates two times as insurance against a potential recession. As yields fell, bonds (represented by the Barclays US Aggregate Index) outperformed the S&P 500 during the quarter and continue to post a healthy return for the year. One of the notable events in the bond market for the quarter was when the 10-year Treasury yield briefly dropped below the two-year Treasury note in mid-August leading to an inverted yield curve.
Despite the often-cited historical phenomenon of an inverted yield curve as a precursor of recession, we are not concerned with the yield curve inversion. Historically, inversions occurred when the Fed was intentionally trying to curb inflation at the end of the business cycle by tightening the availability of credit, which is not the case today. Headline inflation as measured by core inflation index (excluding food and energy costs), has risen year-over-year, remains below the Fed’s 2% target. In addition, investors are faced with navigating an uncharted territory of nearly $17 trillion in negative-yielding global sovereign bonds9. Negative-yielding bonds now represent nearly 30% of the total global bond universe10. Japan, France, Germany, Switzerland are all mired in negative rates, including their 10-year bonds. In fact, Danish lenders are even willing to pay homebuyers to take out a mortgage.
Source: JP Morgan Guide to the Markets, September 30, 2019
As money flows out of negative-yielding markets, it pushes down the yields for US debt on the long end of the curve. The shopping frenzy is not just relegated to foreigners as domestic buyers have also been buying bonds recently. The curse of negative rates will likely be with us for a while and thus a flat-to-inverted yield curve in the U.S. could also continue for a while. While nominal yields remain positive in the U.S., the real yield (after accounting for inflation) on the 10-year Treasury is a negative. Some may scoff at that, but today the US economy is the best house in a bad neighborhood.
Market outlook
Slowing growth pressures, rising but still low inflation, political pressure and negative interest rates abroad will likely force the Fed to cede to market pressure for further rate cuts. The futures market reflects approximately a 74% probability of a 25-basis point cut in October from the current target range of 175-200 basis points and roughly a 35% chance for another 25-basis point cut in December11. The uncertainty surrounding the Fed’s next rate move could have broad consequences across stock and bond markets given the record levels of debt carried by the US companies. For now, with today’s low interest rates, debt service remains easily managed, but eventually rates will rise and depending on how quickly and how high, the potential for debt service to weigh on US earnings and share buybacks cannot be ignored forever. Additional risks include concerns that the trade war broadens tariffs to include Europe and/or that Brexit could pose a risk for global markets beyond just the UK. Notwithstanding these risks, although investors tend to focus on monetary stimulus, the US government is currently running a trillion plus dollar budget deficit providing a significant amount of fiscal stimulus. This combination of monetary and fiscal stimulus leads us to believe that despite slowing economic growth, equity markets and the economy still have some room to run in the near-term.
Portfolio Positioning
Given the current uncertainties, especially regarding the Fed’s future actions, now is not the time for investors to try to maximize return by doubling down on the best-performing asset classes and strategies over the past year or two. Instead, investors should emphasize protecting capital against a sudden trend reversals by broadly diversifying across risk assets and strategies even if they have been relatively poor performers over the past decade. Positioning for an uncertain environment is different from de-risking; rather, it is broad diversification that spreads risk across a variety of risk markets and risk factors. Even when markets have been trending strongly, market timing is a difficult and frequently disappointing sport. For now, money is cheap, but interest rates will eventually rise somewhere in the developed world, and when they do those markets and strategies that had been laggards will become leaders.
|