|
Executive Summary
- Despite a strong first quarter for stocks, investors are likely to be anxious. For the past year, market observers have remarked on the longevity of the current economic expansion and market rally. One year later, investors who anticipated an inevitable reversal of the extended upward price trend for US stocks feel the same anxiety now, but with greater intensity.
- The economy continues to expand even as its rate of growth slows. Despite anxieties about a recession, there is little on the horizon in terms of leading economic indicators to suggest that an economic recession is imminent. This is important because history would suggest an extended market decline is almost never seen outside periods coinciding with an economic recession. While the rate of economic growth is unquestionably slowing, it is not reversing, and the economy is not shrinking.
- Anticipate a slow growth environment. This first quarter, like last year and most of the past ten years, growth stocks outperformed most other stocks. This can be explained by investors’ willingness to pay a premium for the stock of any company able to generate growth in what investors see as an otherwise slow or no-growth economy. FAANG stocks’ earnings continue to grow, even as many other stocks see earnings contract.
- Despite being inverted, the yield curve also signals slow growth rather than recession. We believe the recent news on the significance of the inverted yield curve this quarter is focused too much on an overly simplistic indicator, that is not particularly meaningful in the current environment. In the past, the connection between inverted yield curves and recessions was that the Fed would raise short-term rates to try to slow down an overheated economy and inflation, and would raise rates too high, or too quickly, and accidentally trigger a recession. There is little risk today that the Fed will tighten quickly, although expectations at the end of last year were for the Fed to continue raising rates throughout 2019 and into 2020. The market is now anticipating a small rate cut in 2020, which may relieve some of the weight on earnings and multiples.
- Investors may be tempted to abandon diversification after 10 years of the market teaching them through experience that diversification away from US stocks is costly and rarely rewarded. Ten years of lessons—even if not informed by logic or a longer-term perspective—can be quite compelling. As a result, investors may not appreciate the value of diversifying assets and strategies in other environments. While we remain committed to the importance of diversification, we also believe it is important to regularly remind investors that when the US equity market is delivering attractive returns, diversification will likely be costly in the same way that when equity returns are negative, diversifying assets and strategies can potentially add value.
A strong quarter for US stocks
The US equity return for the first quarter was 13.65%1 continuing the impressive gains of the last several years (the trailing 3-year annualized return for US stocks was 13.51%2).
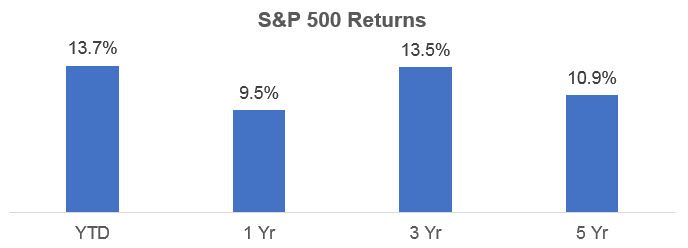
Source: Morningstar. Periods greater than 1 year are annualized.
Perhaps because of the strength and the sheer longevity of the current rally, many advisors are probably fielding questions from clients about when the rally will end, and whether the end will come with a 50% drop from its peak value (similar to what investors experienced in 2008 and 2002) or with a more typical 10%-15% bear market decline. While we think the latter is more likely than the former, we believe such discussions aren’t useful outside the context of an investor’s capacity and tolerance for risk. In Q4 of 2018, many investors thought they were seeing the beginning of the rally’s end and pulled billions out of the stock market in January of this year, only to see the market resume its rally. Implicit in investors’ questions is an assumption that the gains they’ve enjoyed cannot be retained. While it’s true that all rallies eventually end, it’s not necessarily true that all rallies push stock prices beyond sustainable levels. One of the reasons why this expansion has been so long-lived is that its rate of growth has been relatively slow compared to those of other economic expansions. As a result, the extended market rally may end with a whimper and not with a bang, depending largely on interest rates remaining at, or close to, their current levels.
No sign of a recession
While generally the economy should not be confused with the market, the health of the economy is relevant to any discussion of the length or depth of a market pull-back when the current rally ends. Extended market declines have historically only occurred when there was also an economic recession and there does not seem to be signs of an imminent recession. Regional Fed Reserve Bank estimates of Q1 2019 GDP growth are between 1.4%-2.0%, definitely slower than what we saw last year, but certainly not negative. Leading economic indicators—particularly manufacturing—are supportive with low unemployment, rising wages, relatively low nominal and real interest rates, and a strong dollar.
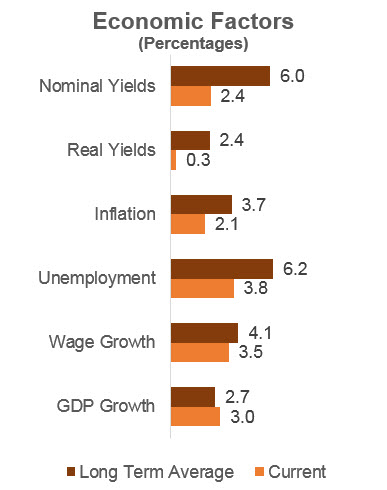
Source: JPMorgan Guide to the Markets, Q2 2019
Slow growth ahead
Volatility is always a risk late in a market cycle and it can be informative to look below the surface of the broad US stock market returns, to the returns of its constituent stocks, to better understand what may be driving it and what it may suggest about the future. The most recent quarter, like many of the years before it, was a mixed story of many stocks rising slowly, if at all, while a handful of stocks that were growing their earnings drove the increase in the overall index. The top ten contributors to the return of the S&P 500 (remember the FAANG stocks?) contributed 25.6%3 of its return for the quarter. This recurring phenomenon reflects the fact that in the low-growth economy which we’ve had for a while, investors have been—and continue to be—willing to pay a premium to invest in that part of the economy which is growing. This trend also results in the index outperforming most active managers, since attractively-valued stocks are at least part of most active managers’ stock selection criteria. Indexes, on the other hand, have a built-in momentum bias, so as the price of growth stocks increases at a faster pace than other stocks, their weight in the index increases. As investors put more money into the indexed strategies, an increasingly larger portion of the index is represented by these growth stocks, because they now have larger market capitalizations as a result of their share prices being bid up. Their larger market cap means that as more money flows into indexed strategies, a larger portion of these flows go to growth stocks, creating a compounding effect that gives a momentum bias to indexed strategies. Each new dollar goes to these same growth stocks, extending the upward trend of these growth stocks. Investors’ relatively modest expectations for the pace of expansion, up through this quarter, are part of what provides some comfort that the end of this rally may not be marked by an extended and dramatic reversal. One possible reason is because the market has appreciated over the past decade at a rather measured pace focused on those sectors which have been growing. This is in contrast to the irrational exuberance leading up to the Great Financial Crisis of 2008 that inflated the value of all stocks, many beyond what was sustainable.
What the yield curve is telling us
There has been a lot of discussion in the financial media about the first quarter of 2019 witnessing an inverted yield curve, and the significance of an inverted yield curve given its history as a reliable precursor of recession. Some less-discussed topics are: the fact that the lead-time between an inverted curve and a recession can be as long as 2 years, and that the shape of the yield curve can be distorted by demand from foreign investors who are attracted by the higher yield on US bonds relative to those on their home-country bonds. When it comes to markets, every time someone (including me) says, “This time is different” investors should be wary. Historically, inverted yield curves have been caused by the Federal Reserve hiking rates to slow down growth and inflation, but in the process hiking rates too quickly or overshooting its target and accidentally triggering a recession. That hardly seems to be the case today, as the fourth quarter of 2018’s presumption of steadily increasing rates into the beginning of this year and through the end of 2020 have given way—after slowing economic growth, few indications of inflationary pressure and continued global trade tension—to the market’s current expectation that the Fed will actually cut rates by 25 bps sometime in 2020. Why? After slowing economic growth, there are few indications of inflationary pressure and continued global trade tension. The Fed is in a very difficult position and may find it hard to raise or cut rates. The Fed is under political pressure from President Trump, who has made it clear that if the economy falters and the stock market drops as it did in Q4 of 2018, he will lay the blame on the Fed. And, if the Fed cuts rates, investors would probably take that as a signal that the information available to the Fed indicates signs of a much weaker economy than currently recognized by the market, which could also cause the stock market to drop.
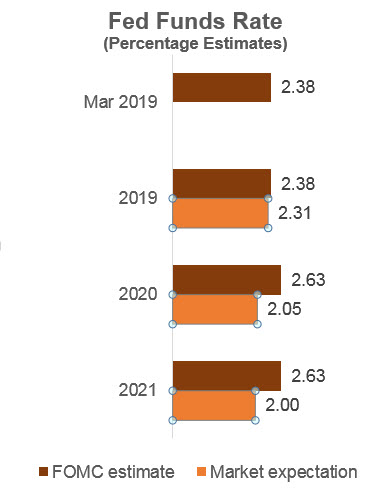
Source: JPMorgan Guide to the Markets, Q2 2019
Outlook
For the past 10 years, investors have seen active managers underperform indexes, growth momentum outperform value, large-cap stocks outperform small-cap stocks, and US markets outperform international. Investors may be saying diversification doesn’t work and managed futures and tactical strategies are a waste. While managed futures performed in line with bonds for the quarter, they have been costlier over the past few years. It is sometimes a tough message to share with investors that there is new, conventional wisdom about what works in investing and what doesn’t; and it may be hard to maintain these new beliefs without breaking our relationship of trust with investors. Someone who thinks that the best basis for forecasting the weather tomorrow is the weather today may well see this relative performance continue.
Portfolio positioning
The future may simply extend the slow economic growth of the past decade, which may be exactly what many investors have expected given that it has worked for so long. If this is the case, stocks should continue to outperform bonds, index or momentum strategies should likely continue to outperform active valuation-focused managers and the U.S. should outperform developed international stock markets, as the U.S. will be less impacted by global trade tension than export economies like Japan, Germany and Taiwan. The market has a way of behaving a certain way just long enough for investors to decide there is a new reality. They then act on this “insight” just in time for markets to start behaving differently. I point this out because investors may have developed a confidence in how stocks will do versus bonds, and how alternatives will do versus traditional investments; and it may be difficult to convince them that when it comes to investing, the last ten years is not indicative of the range of scenarios investors can expect in the long term. Despite this truth, market results may ultimately play out just as investors expect. It is in such instances that we can console ourselves that part of what we get paid for, as advisors and investment managers, is to provide counsel that hindsight might be wrong.
Conclusion
Studies show behavioral coaching to be one of the most valuable services provided by advisors. But 10 years of a rising US stock market, with periods of unusually low volatility, has the potential to convince some investors that the opportunity cost of diversification away from US stocks is too great. Advisors will try to convince investors otherwise, but it may be a challenge with some investors who conclude that diversified portfolios are overly conservative. Convincing investors otherwise may require use of a 20-year, or longer, look-back window to simulate how different portfolios with different asset allocations would have held up in different environments. Or, it may be as easy as pointing to the US market drop, observed at the end of 2018, after the three strong prior quarters. Or advisors can point to the outperformance by small-cap stocks in the U.S. after years of large-cap stocks driving the market. If neither of these approaches works, advisors and investors may want to consider meeting half-way, since a client with some diversification—even if it is less than optimal—is better than no diversification.
|