|
Executive Summary
- The market decline will likely extend into early 2019. While it would be nice to be able to tell investors the market is likely to bounce back by the end of 2019, truth-telling tempered with cautious optimism can sometimes be more reassuring to investors. The reality is that we are in the late stage of a secular bull market and much of what we are observing is not surprising in that context: market turbulence, rising rates, slowing earnings growth, low unemployment, and widening credit spreads.
- The 9+ year bull market is likely not yet finished. Having acknowledged that we should not be surprised by the current market correction, it is not clear that the longer-term bull market is finished. While a bear market is technically defined by a market drop of 20% or more, extended bear markets usually coincide with an economic recession, which we do not currently see on the horizon. The US economy continues to expand, consumer spending is strong, corporate earnings continue to grow, unemployment is remarkably low and likely to fall further, inflation is low and steady, and Federal Open Market Committee (FOMC, the Fed) tightening is measured and cautious. What investors are currently experiencing may be similar to 1994-1995 when the Fed raised rates 300 basis points. During this period price-to-earnings ratios contracted, causing the market to struggle even as earnings continued to grow. Once the Fed reached its target and rate hikes stopped, the markets stabilized and stock prices began to climb. In its announcement of the latest rate hike, the FOMC revised its expectation for further rate hikes in 2019 down, from 3 to 2, and despite the market’s fear of the Fed accidentally triggering a recession, it is not the Fed’s intention to stall economic expansion and any material softening in the prospects for the economy is likely to result in the Fed’s pausing further hikes to stabilize the economy.
- A 15+ % drop is not unusual from an historical perspective and investors should not assume it’s the beginning of the end. Drops of more than 15% on average occur roughly every 3 years and have only slightly greater risk of evolving into a loss of 20% or more than it does of recovering. Drops of 15% -20% on average have taken 3.5 months to hit bottom and another 4.7 months to fully recover to its prior peak1. Even in this most recent extended rally we have seen a number of corrections that were disheartening in the moment but in hindsight were merely bumps in the road: a 10.2% drop early in 2018, a 14.2% drop that ended in early 2016, a 19.4% drop in 2011 and a 16% drop in 2010.
- Politics dominate the headlines but earnings drive the market. There is no shortage of news in the U.S. that individually or cumulatively may saddle investors with pessimism. Fear of war, criminal investigations surrounding the US president, policy uncertainty, and a partial government shutdown can certainly contribute to market volatility in the short term, but the more substantive drivers of the market’s correction are the fading impact of the tax and spending stimulus relative to 2018 , the potential impact of a trade war with China on US corporate earnings, and fears that the Fed is tightening money supply too quickly. The growth rate of earnings is indeed slowing, but they are still growing. A slower growth rate for earnings and higher (though still not restrictive) interest rates can justify a lower multiple but this does not mean that the market won’t regain its footing and continue to advance on the basis of growth in earnings with continued help from corporate stock buybacks which are expected to be 22% higher than the record amount in 2018.2 Finally, while the risk to earnings of a trade war with the world’s second largest economy, China, are real, the economic consequences that are already being felt places enormous political pressure on both Presidents Trump and Xi to ultimately come to some agreement.
- Diversification in client portfolios is now more important than ever. A change in market dynamics is likely to be accompanied by a change in market leadership. What has done well in the past may very well struggle in the period ahead. The diversification message is sometimes dismissed by investors in periods such as 2018 when every major asset class suffered a negative return.3 But the reality is that sometimes the benefit of diversification is holding asset classes or strategies that lost less than investors would have experienced in an all large-cap US equity portfolio. With lower correlation among stocks, active managers going forward may finally have the opportunity to outperform index managers. Select international stock markets may finally outperform US stocks as the headwind of a strengthening dollar weakens. With widening credit spreads, municipal bonds may become attractive for reasons other than tax-free income. The environment going forward may present attractive opportunities to strategists who can selectively invest globally for enhanced return and may cause high-yield strategies that have in the past handily outperformed investment-grade debt to struggle. Advisors with clients who are overly anxious about the gyrations in the value of their portfolio may want to revisit that client’s risk tolerance given that realized market volatility is, at the moment, not that far above the market’s long-term average. This may be particularly important for clients in distribution mode if they are systemically making distributions from equity portfolios, increasing the difficulty of bouncing back when the market eventually recovers. Consistent with these thoughts on diversification, some of our strategists are tactically reducing their equity exposure to limit losses, with an eye to systematically adding equity exposure back once they see signals that suggest the market has regained its footing.
Introduction
In 2018, US investors experienced negative returns in almost every major asset class. The exception to this was US bonds which had a return for the year of 0.0%4. Every other asset class, both domestic and international, declined in value for the year. This was a particularly alarming turn of events for US equity investors who, as recently as last quarter, were enjoying year-to-date returns of 10.6% and strong economic fundamentals that provided a promising near-term outlook5. A mere three months later, full year returns for US stocks were negative 4.4% and negative 8.9% for global stocks6.
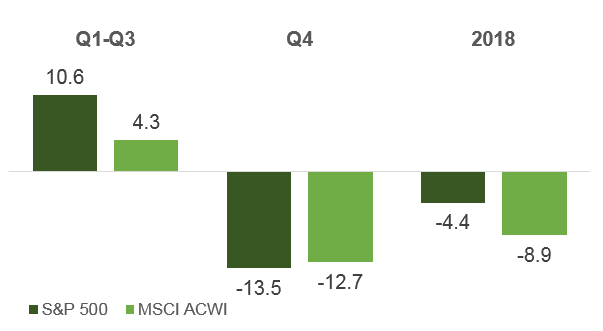
Source: FactSet
The precipitous drop in stock prices during the third quarter left investors shaken and worried that they were experiencing the beginning of the end of an almost 10-year stock market bull run and left them wondering whether prudence dictated paring back the size of their stock allocation. This was especially true on Christmas Eve when investors had experienced nine consecutive down-market days. Investors weren’t just anxious they might get a lump of coal for Christmas, they were pretty sure they were watching the coal truck backing up and making a giant delivery.
While the last few days of the year provided a bounce in share prices off their lows, investors remain unsure of what to expect in 2019 with plenty of conflicting signals. On the one hand, the market is deep into a lengthy bull run, economic growth has been accelerating and unemployment is at a 50-year low. On the other hand, the rate of growth seems likely to slow, interest rates are climbing, and volatility has increased. This combination of good news/bad news is not unusual for what we would expect in a late cycle bull market.
Market probably has not yet found its bottom
While we believe we are probably still in a bull market, this doesn’t mean the market may not fall further before it recovers. But even if it does, such events are relatively short-lived on average taking 3.5 months to bottom and another 4 or 5 months to fully recover7. Investors who think prudence dictates an exit from stocks must also have a signal they are monitoring for timing their re-purchase of stocks. If not, they are almost certain to repeat the classic investor mistake of selling and then staying uninvested while the market rallies. Successfully timing the stock market once is difficult, twice is close to impossible for the typical investor.
Investors should also keep in mind that the market correction they’ve just experienced (a negative 19.3% return from the market’s high point in September through its low on December 24th)8 is disorienting but not extraordinary. Market drops of between 15 and 20% occur roughly once every three years on average9. And while such drops often go on to decline by more than 20 percent, the probability of this is slightly greater than that of the market recovering. Investors who are confident this drop is the “beginning of the end” of the current rally should be reminded of the corrections that occurred earlier in this rally, which in hindsight we now see were bumps in the road and not the end of the road. These include the 10.2 % drop in early in 2018, the 14.2% drop that ended in early 2016, the 19.4% drop in 2011 and the 16% drop in 201010.
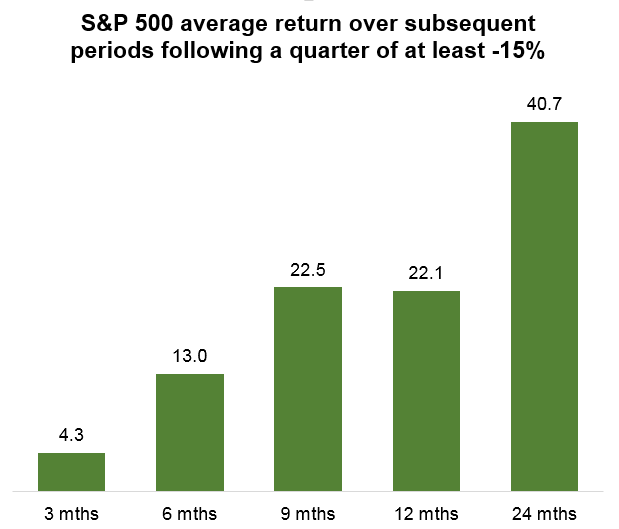
Source: Ned Davis Research, “Q4 is Bad. Is that Good?”, Dec 26, 2018
Ned Davis Research, a market and economic research firm with a newsletter widely read by investment managers, pointed out that the steep sell-off in the nine days ending Christmas Eve resembled the panic selling of 1962, 2002, and 2015. In each case, the market subsequently made a lower low but had double digit gains one year later. While the steepness of the sell-off may partly be technical and attributable to computerized trading programs, part of it is behavioral. Investors see a market drop and assume other investors must know something they don’t and so they follow suit, thus depressing the market further and catching the attention of even more investors who also sell, and so on. Even if drops in the market don’t cause investors to sell their stock, the increase in perceived risk can lead them to postpone additional purchases adding to the price pressure on sellers.
Beyond echoing past market patterns, the prospect of the US stock market re-testing December’s low early in 2019 does not seem far-fetched. Investors are trying to synthesize the implications of slowing economic growth, rising interest rates, narrow market breadth, and an increase in market volatility/investor fear. Before the uptrend can resume, the bottoming process must be completed. US investors need to first grieve the loss of the fiscal stimulus and monetary accommodation that drove accelerating earnings for the first three quarters of 2018, before eventually accepting the fact that earnings seem to be continuing to grow regardless of the relative pace of that growth.
Although there are a lot of distractions to fuel investor anxiety and pessimism in the near-term, including Fed rate hikes, trade tensions with China, and government dysfunction, none of them seem significant enough today to drive the market longer term. Investor anxiety and computerized trading may be important drivers of recent market moves, but earnings will likely be the key driver of market moves longer term.
The longer term outlook for US stocks is likely still bullish
Trends in stock prices – up and down – are not sustainable indefinitely because ultimately value considerations become increasingly important or the increasing pessimism or optimism about stocks becomes so broadly held that there are no investors on the sidelines left to add to the trend. In this sense, the seeds of every market reversal are contained in the market that preceded it. As a result of the Q4 decline in stock prices, P/E multiples at the end of 2018 fell to 14.4x, slightly cheaper than the average P/E multiple over the past 25 years of 16.1x11.
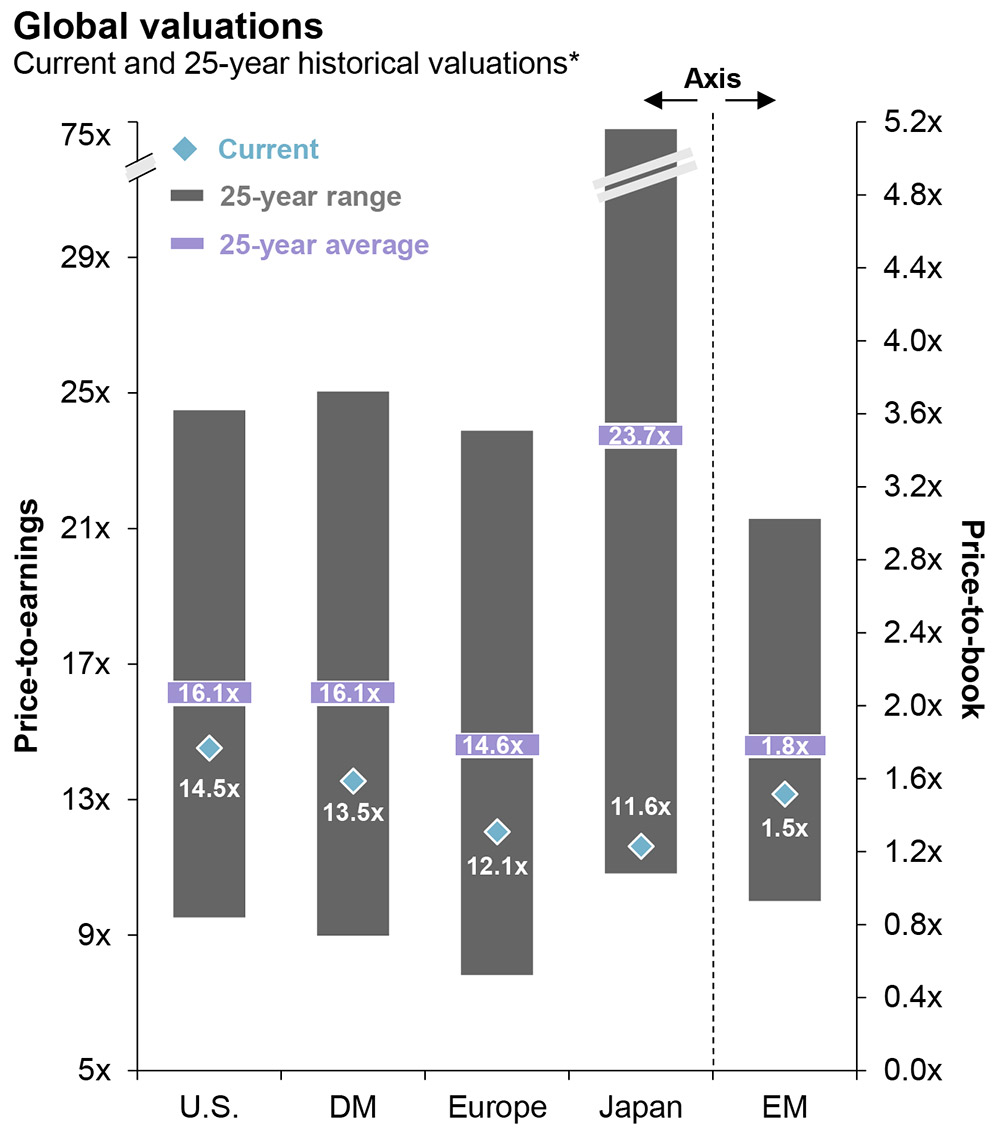
Source: JPMorgan Guide to the Markets Q1 2019
In addition, the justification(s) that investors use to rationalize their sense of pessimism leads the market to be priced to the worst-case scenario. Thus, for example, to the extent stock prices fall based on fears of an overly aggressive Fed, a signal in the future by the Fed to slow rate hikes might give investors a renewed sense of optimism about the market.
As we begin 2019, the US economy looks remarkably healthy. Economic growth has recently been accelerating through the third quarter and the consensus projection for GDP growth in 2019 is 2.6%, which is as high, or higher, than each of the last ten years, with the exception of 2015 and 2018 when GDP rose 2.9%12. Unemployment is at a 50-year low and is still falling, inflation seems well under control, and leading economic indicators are still pointing up and do not show a recession on the horizon. The low likelihood of a near-term recession is key, since without a recession any drop in the market is likely to be relatively short-lived (less than a year). Another point we have made before, and is worth repeating, is that while the pace of economic growth is slowing, the economy is still growing. To use a car analogy, slowing growth is akin to easing up a bit on the accelerator but the gear shift is still in drive and not neutral or reverse. And it is not really surprising that the rate of growth in the economy and earnings would slow as the impact of the extraordinary corporate tax cuts and fiscal stimulus approaches its end.
The primary source of investor concern for the US stock market would seem to stem from the Fed’s program to gradually raise interest rates in order to contain the risk of inflation. Because no one really knows at what level interest rates are “neutral” (neither accommodative nor restrictive), investors fear the Fed will raise interest rates until they inevitably become restrictive and trigger a recession. However, the Fed has been fairly cautious about its rate hikes, adjusting the number each year based on data about the economy. While a misstep is always possible, any increase that interrupts economic growth - let alone triggers a recession - is DEFINITELY something the Fed wants to avoid.
One concern about rising rates is that they can put downward pressure on corporate earnings or consumer demand by increasing the cost of interest payments on debt. This is a frequently articulated concern given that companies have incurred record amounts of debt. Despite this, it is important to remember that the cost of servicing this debt should remain relatively low for at least the next several years because companies borrowed longer-term when interest rates were low and so interest coverage for companies remains healthy. Household spending -- which remains the most important driver of our economy – does not seem particularly vulnerable to rising rates because financial obligations as a percent of personal income is currently relatively low in the context of history.
If the economy is healthy and the Fed is not looking to interrupt growth, why has the market experienced such a deep drawdown? The answer is that price-earnings multiples are not unrelated to interest rates. The higher the interest rate, the lower the multiple investors assign to stock prices. This makes sense as cheap borrowing allows even low-quality companies to remain afloat and provides a tool for the fastest growing companies to leverage their balance sheets by financing more initiatives at once, thereby growing more quickly than otherwise. In fact, the recent decline in stock prices would seem primarily -- if not entirely -- attributable to the contraction in price multiples rather than a reduction in forecasted earnings.
What investors are currently experiencing may be similar to 1994-1995 when the Fed raised rates 300 basis points. During this period price-to-earnings ratios contracted causing the market to struggle even as earning continued to grow. Once the Fed reached its target and rate hikes stopped, the markets stabilized, and stock prices began to climb. In its announcement of the latest rate hike, the Fed revised its expectations for further rate hikes in 2019 down from three to two, and it is safe to assume their decisions will be “data-dependent” and it will likely pause further rate hikes if any material softening in the economy is observed. Skepticism about the Fed’s ability to manage inflation without accidentally triggering a recession has caused the market to focus on interest rates in isolation and lose sight of the fact that if the Fed raises interest rates, it is because it believes the economy is strong enough to absorb it.
Lower price multiples caused by the fear of rising rates may explain the drop in stock prices, but what needs to happen for stocks to rebound? One answer is that stock prices may rebound even if price multiples do not due to continued growth in corporate earnings. A second possibility that we mentioned earlier is rooted in the idea that markets care more about changes in expectations than in expectations themselves. As a result, if slower earnings growth is evidenced in 2019, the Fed may pause its rate hikes, in turn leading market analysts to change their expectations. Changes in expectations for trade relations between the U.S. and China could also help the market to recover. Finally, we have not yet seen the impact of what may be the stealth driver of US earnings growth: corporate stock buy-backs. Last year represented a record amount of stock buy-backs by companies. While buyback activity in 2019 is unlikely to see the same year-over-year growth experienced in 2018, the amount is nevertheless expected to grow, making 2019 a new record for corporate stock buy-backs and helping to support continued growth in earning per share.
We have focused on the outlook for the US stock market because that is usually the focus of US investors, but it is important to consider the prospects for foreign stock markets as well. In the past, foreign stock exposure has been a drag on the portfolio returns of US investors, but there is the potential for change in 2019. Part of the reason why foreign stocks have been a headwind for US investors is the long-lived trend of the strengthening US dollar relative to foreign currencies. The US dollar may continue to strengthen early in 2019 as US growth remains strong and trade policy with China remains surrounded by uncertainty, but later in 2019, as the Fed potentially demonstrates its cautious approach to rate hikes in the face of slowing economic growth at the same time that the European Central Bank might begin tightening, provides the possibility that the value of the US dollar versus other currencies finishes 2019 flat or slightly down. Beyond seeing some relief from the falling value of foreign currencies, we may also see returns, even in local-currency terms improve, particularly in Asia.
China’s central bank had been focused on de-leveraging China’s banks and large companies by raising interest rates at the end of 2017 in order to slow growth and reduce the risk of a credit bubble. In contrast, the People’s Bank of China announced at the end of 2018 that it would supply lower cost liquidity for as long as three years to banks willing to lend more to smaller companies in an effort to stimulate its economy.
The outlook for interest rates
Although unemployment is low, automation and the globalization of supply chains have allowed inflation to remain contained. Even if the most recent Fed “Dot Plot” projection of two rate increases in 2019 turns out to be reliable, this implies a Fed Funds rate of roughly only 3.00%. Arguably the more important question for businesses, homeowners and bond investors is not what happens to the Fed Funds rate, but what happens to longer term yields such as that on the US Treasury bond. The term yields are the aggregation of a lot of short term yields. The prospect of low inflation suggests that the relatively flat yield curve we have today (the 10-year yield is only 25 basis points or so higher than the Fed Funds rate) will likely continue into the future. While the yield curve may steepen slightly in 2019 (longer maturity yields rising more than shorter maturity) due to the combination of the Fed’s program to normalize its balance sheet and continued growth in the federal budget deficit, global growth prospects and the lack of inflationary pressure suggests the yield curve will remain relatively flat.
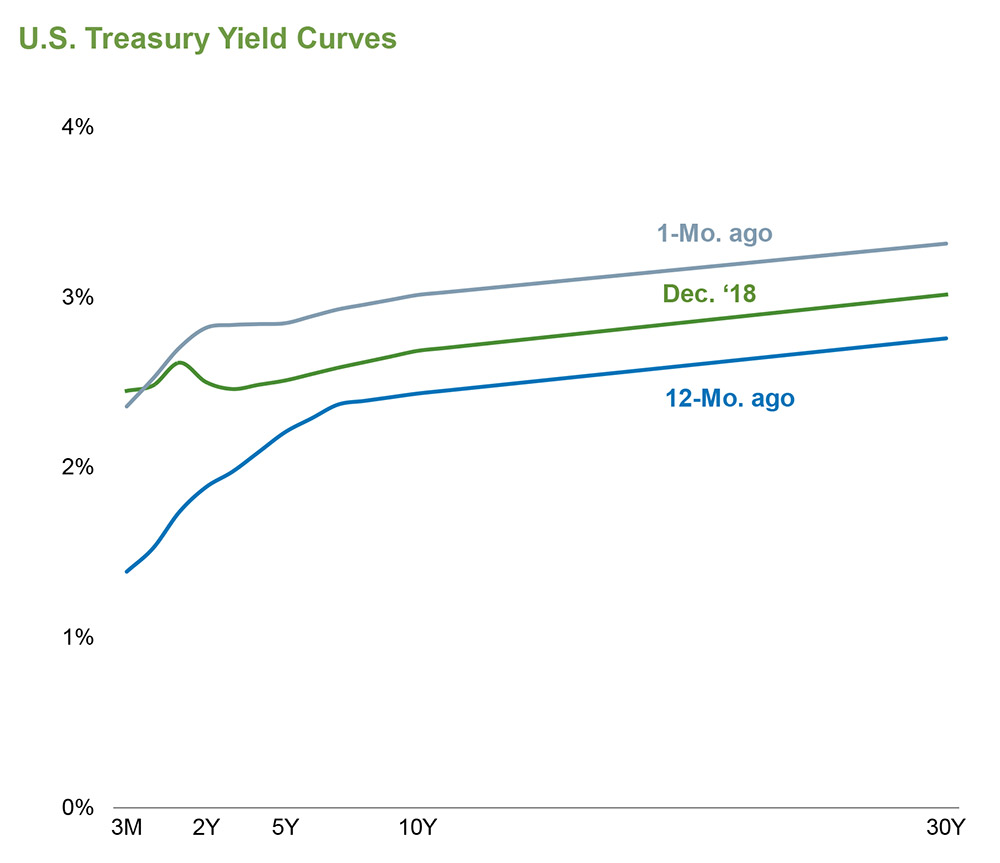
Source: Eaton Vance Monthly Market Monitor January 2019
An inverted yield curve is frequently cited as a reliable harbinger of a recession. As a result, a fair amount has been written about how the flatness of the yield curve makes us susceptible to a potential inversion. It is important to remember that a simple rule of thumb masks a much more complex reality, and close and partial inversions are not the signal investors are monitoring which tends to be the 10-year Treasury bond yield versus the 2-year Treasury bill yield. The expression that “close only counts in horseshoes and hand grenades” is relevant to the implications of yields curves that are flat but not inverted.
Finally, although the Treasury yield curve is the baseline relative to which corporate borrowing rates are set, it would not be surprising to see the total return on high yield bonds struggle as corporate spreads widen continuing the recent trend. Despite the increase in the required credit premium, credit spreads remain tighter today than they have been on average over history.
Recommended portfolio positioning
The markets are unsettled and it is more challenging than usual to know how investor portfolios should ideally be positioned. What has worked well in the past may not work well in the future. As a result, perhaps the best we can do for investors is to make sure that they continue to be well-diversified, recognizing that this sometimes means losing less in the short run. For example, in the fourth quarter the managed futures index was down 5.1% while the S&P 500 was down 13.5%13. The narrow leadership in 2018’s stock market rally that favored large cap growth stocks may shift to reward quality either temporarily or longer term. Different stocks in the same sector may enjoy very different returns depending on the specifics of their situations.Such an environment may favor active management over index-based investing. Separately, the strengthening dollar that has been a headwind for US investors holding foreign assets may abate -- or even reverse-- potentially making select international markets more appealing than in the past to US investors. Widening credit spreads may depress the total return of high-yield positions but may recover along with US stocks. Finally, while earnings-- rather than politics-- will drive the market longer term, investors need to be prepared for the unexpected as political “distractions” cause short-lived market surges and drops. All of this makes the timeless advice to diversify more relevant than ever. The asset class or strategy that holds investors back this quarter, may very well become the engine that fuels returns in the following quarter or visa versa.
Calendar Year Returns by Asset Class
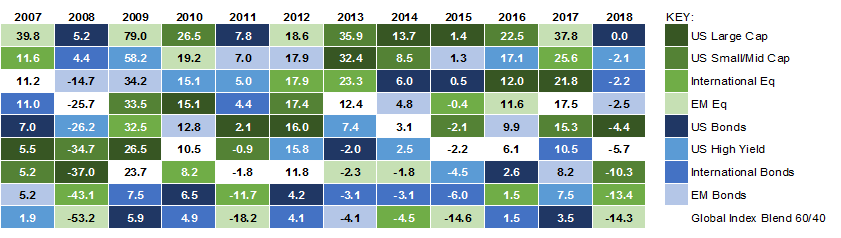
Source: Factset, Zephyr Style Advisor
Despite this environment, certain investors may feel they need to do something in order to feel in control of their financial future. For such investors, we will hazard a few suggestions that can reduce risk at the margins:
- Make sure there is some allocation to international stocks, perhaps with a strategist that has the flexibility to tactically emphasize select regions.
- Diversifying bond holdings to include US Treasuries as well as corporate and high yield bonds. This might imply some yield opportunity cost in the near-term but may help to preserve principal if credit spreads continue to widen.
- Earnings growth has driven the market for so long investors may want to ensure that their allocation to stocks is well-diversified among return drivers and not overly focused on stocks that have recently demonstrated strong price momentum.
- Although realized volatility has significantly increased relative to that of the past few years, it is not dramatically higher than the market's long-term average. Investors whose discipline has been shaken by recent price movements should revisit their risk tolerance to make sure it is still appropriate for them.
The road ahead for investors may be filled with twists and turns that will be difficult to anticipate, but investors should take comfort that, in the long term, stock markets go up as earnings grow. While downturns will happen, they are generally short-lived compared to the longevity of periods during which stock market values are climbing. Given the uncertainty of the precise path ahead, a well-diversified portfolio of asset classes and strategies will provide investors the smoothest ride and help them to achieve their long-term financial objectives.
|