|
Executive Summary
Keeping up with the Joneses
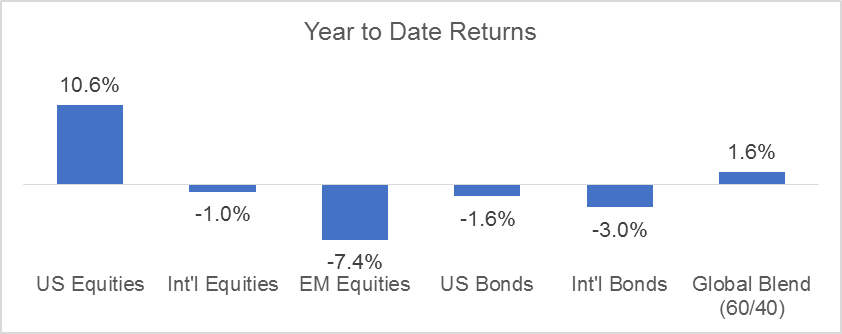
Psychology and markets are inextricably intertwined, and generally to the detriment to investors. Two behavioral finance phenomena are “availability bias” and “anchoring”. Availability bias refers to focusing on a piece of information that is readily available to investors such as the return of the US stock market. Anchoring is the tendency for investors to get stuck on one piece of information, such as the return of US stocks and, even though it’s not relevant, use it to judge other investments. Awareness of these phenomena will be important given that, for both Q3 and year-to-date in 2018, US stocks enjoyed significantly higher returns than either bonds or international stocks. As a result, an investor whose expectations were set by reports that the S&P 500’s return was 7.7% for the quarter and 10.6% year-to-date may be disappointed that their 60/40 global balanced portfolio returned closer to 2.3% and 1.6%, respectively, for those same periods2.
Fortunately, it may not be difficult to convince investors to reset their expectations to be more realistic once they understand that year-to-date returns for both bonds and international stocks were negative at -3.0% and -1.0%, respectively3. Investor anxiety about the longevity of the US stock market’s rally may predispose them to accept the reality that the diversification that weighs on their return today will help protect them when volatility increases or the market experiences a correction.
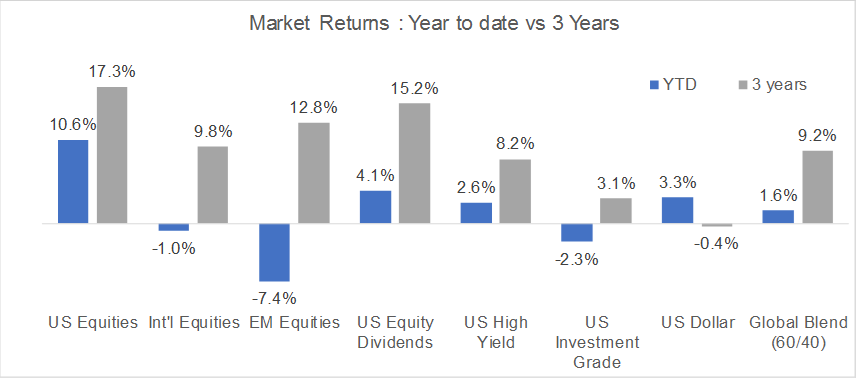
Investors who are unhappy with any of their holdings may take comfort from the longer-term performance of that same holding. Over any reasonable measure of time, returns for investors in global balanced portfolios would likely be considered attractive in absolute terms. Even if they only look back 3 years, they will see global equities have returned an annualized 14.0% and a 60/40 global balanced portfolio has returned an annualized 9.2%4. Although US equities will still have outperformed international equities over that time period, almost every asset class on a standalone basis shows respectable average annual performance. Some examples of how a 3-year horizon can help put year-to-date asset class performance in perspective can be seen in the chart below:
Source: AssetMark, Zephyr Style Advisor
Adopting a slightly longer horizon when evaluating performance can be helpful by providing some perspective on how a strategy is performing over time versus trying to judge it on the basis of a single snapshot. Evaluating an investment based on its results over short periods of time can lead to return-chasing behavior where the investor is like a driver in a traffic jam who keeps shifting into the fastest moving lane only to find it is the one they just left.
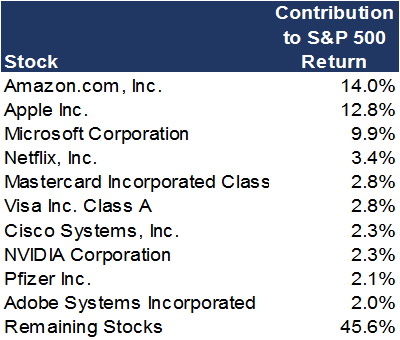
Investors whose exposure to US stocks is not through indexed ETFs may question why the returns of their US stock holdings trailed those of the index. The explanation is straightforward given the concentrated leadership that tends to characterize late stage market rallies. The four best-performing stocks (Apple (AAPL), Amazon (AMZN), Microsoft (MSFT), and Netflix (NFLX)) year-to-date accounted for 40% of the return of the S&P 500 and the 10 best-performing stocks accounted for fully 54% of the return of the S&P 5005. From a style perspective, stocks selected based on attractive valuations (sounds reasonable, right?) experienced year-to-date returns that were dramatically lower than those of growth-oriented stocks.
One theory of why investors emotionally benchmark against the US stock market is that they believe it is representative of how their neighbors’ investments are doing. It might be reassuring for them to consider that after excluding pensions, the allocation of US household financial assets is roughly 50% in US stocks, 18% in international stocks, and 32% in fixed income6. In other words, the return earned by their neighbors is closer to that of the investor themselves, than to that of the US stock market.
Market Outlook
The question on all investors’ minds is how much longer will this rally in US stocks last. Multiple factors feed a stock market rally and as a result no one can provide a precise answer to this question. Having acknowledged this, we can say that while economic growth is slowing, it is not slow. In other words, economic and market fundamentals still look good and are likely to continue to support the market in the near-term, but the pace of the economic expansion is slowing. Sometime next year the current rally may take a pause–or even reverse– after the last drop of fiscal stimulus from the tax cuts is received when tax refunds are mailed mid-2019.
Beyond economic fundamentals, the market will also be fueled by the continuation of what is expected to be a record setting level of share buyback activity. Over $1 trillion in stock buybacks were authorized in 2018 and buybacks are expected to continue through the end of 2018 and into 2019. Corporate share buybacks dwarf all other sources of demand for US stocks. By shrinking the number of shares outstanding, stock buybacks have the effect of increasing Earnings Per Share (EPS). This is important because approximately 72% of the rise in the S&P 500 since the end of the Great Financial Crisis in March 2009 has been attributable to growth in EPS vs. expansion in valuation multiples or margins7. In fact, since the beginning of this year the Price-Earnings multiple of the S&P 500 has actually contracted by 7%8.
Other reasons for near-term optimism about the market include: strong consumer confidence; demand from foreign investors whose home markets have weaker growth and currencies; and the pattern observed in past mid-term election years of a strong fourth quarter once the uncertainty of the election results has been resolved.
Beyond our near-term view that recession risk is minimal and US stock prices are likely to continue to rise, we also expect US stocks to outperform international stocks despite the relative attractiveness of valuations of international stocks. We favor strategies in the near term with a US-bias, given that the US has the potential for more robust growth, stock buyback activity, and continuing capital inflow from foreign investors.
Our expectation, consistent with that of the market, is for the Fed to again raise interest rates this December and then three or four more times after that. However, we expect the yield curve to remain relatively flat. Consequently, we believe the best-performing fixed income sectors in the near-term are likely to be shorter maturities and high-yield bonds.
Risk Assessment
Given investor anxiety about when the current stock market rally will end, we can expect investors to have a lot of questions about potential risks and for the financial news to explore many of these questions. While I believe there remains room for continued market appreciation, I don’t want to be mistaken for a perma-bull. The reality of market and business cycles is that the same dynamic that is good news for the market in the near-term may be sowing the seeds for a downturn in the intermediate or longer term. Markets do not go up endlessly without interruption. For this reason it is important when evaluating market risks to keep time-frame in mind. A high risk situation that is likely to emerge in the longer term does not necessarily necessitate action in the near-term. As the saying goes, the difference between salad and garbage is timing. Listed below are a number of potential risks that investors may want to discuss with our assessment of each.
Debt Levels
Excessive leverage is a common catalyst for recessions. When evaluating leverage, the amount of debt is less important than the ability of borrowers to pay the interest on that debt. While household debt in the U.S. is currently at very manageable levels, corporate debt in the U.S. is at record high levels. It would not be difficult to imagine a scenario where rising interest rates drive up the interest expense on that debt until an economic downturn causes low-quality corporate issuers to default. But a critically important consideration when evaluating this risk is that after 2008, corporations shifted their mix of long and short-term debt in favor of long-term debt in order to lock in historically low interest rates for as long as possible. For this reason, we expect corporate debt service coverage to remain healthy for at least three or four more years.
Outside the U.S., potential areas of excessive leverage include emerging markets, particularly those countries that have issued US dollar-denominated debt. Emerging markets have roughly $8 trillion in dollar-denominated debt outstanding. If interest rates continue to rise and the dollar continues to strengthen, the cost of servicing this debt could quickly become burdensome. Mitigating factors relevant to this risk are that emerging market countries have greater reserves on hand today than during past crisis periods and the fact that the Fed’s current plans seem unlikely to raise interest rates to a problematic level for emerging market countries. A more compelling case for excessive leverage can be made in connection with the real estate market in China. Real estate prices in China’s cities are roughly 38% higher than in the U.S. even though the per-capita income of the U.S. is approximately seven times higher than that of China9. Much of this real estate is reportedly vacant having been purchased by individuals as speculative investments with financing from Chinese banks. As the Chinese government seeks to deleverage its banks, it may be tough to do without hurting individual investors. While this is not an easily managed situation, the Chinese government has repeatedly demonstrated that, unlike a western government, it has tools at its disposal that allow it to “buy” itself the time required to resolve economic issues without precipitating a crisis – including a recent government directive prohibiting the reporting on negative news about the economy.
Finally, the European Union (EU) still does not have a clear plan for how to deal with a country in the eurozone that rejects fiscal austerity. The concern next year will likely be focused on Italy which will be a much larger problem than Greece and harder to resolve unless, as we suspect, the European Central Bank (ECB) agrees to provide some kind of support, in order to kick the can down the road, deferring the problem until some future date.
Political Risk
With mid-term elections coming up in the U.S. next month, there will be a lot of speculation about what it might mean for business and the markets. If history is a guide, it would suggest that regardless of the election’s outcome, the market will be higher than today 12 months after the mid-term election. Given how polarized US politics currently seems, investors should remember that the market likes political gridlock. Gridlock increases certainty for business by minimizing the risk that new legislation gets passed changing the regulatory or tax environment. Indeed, gridlock currently appears to be the most likely outcome of the mid-term election with polls suggesting an approximate 80% probability that the Democrats win control of the House of Representatives and an approximate 70% probability that the Republicans maintain control of the Senate.
Inflation
The US labor market is extremely tight at 3.7% unemployment and expected to get even tighter10. This might raise the fear that inflationary pressure on wages could reduce corporate profit margins and therefore earnings. Having said this, the TIPS (Treasury Inflation-Protected Securities) curve is flat to 10 years suggesting there is little concern among traders and investors about long term inflation accelerating.
Rising interest rates
The fear is that if the Fed were to raise rates too quickly or too high, it would contract the availability of credit and trigger a recession. However, the stock market can absorb interest rate increases so long as they are gradual and the Fed appears likely to continue its pattern of increasing rates in 0.25% increments no more frequently than quarterly. Given the measured pace of rate increases, the key question becomes the Fed’s ultimate rate target. The Fed’s latest “Dot Plot” indicates the expectation of one more rate hike in December of this year with three more in 2019, rising gradually to a range of 3.25% - 3.50% by the end of 2020 from its current range of 2.00% - 2.25%11 (which—depending on whom you ask—is only slightly more restrictive than neutral). Investors may remember that the Fed started tightening and raising rates before there was any anxiety about inflation in order to have monetary tools available in the event the recovery faltered. In the same spirit, if the Fed sees growth slow more than desired, it retains the discretion to pause its rate hikes or even to cut rates.
Tariffs
Concerns about tariffs, particularly vis-a-vis China, are frequently cited as a potential threat to the US economy, but 70% of the revenues of the S&P 500 are generated domestically, and 73% of offshore revenues are from the Americas rather than Europe or Asia12. This, together with the practice of global companies localizing production and distribution to be closer to customers, and to have the option to arbitrage tax and trade policies, may explain why the market seems to have largely shrugged off concerns about tariffs.
Excessive optimism
Ironically, another potential risk that may be raised is the high level of consumer confidence that is a supporting factor for the current rally. Consumer Confidence is unusually high today which perversely leaves little upside for changes in consumer behavior since so many consumers are already so positive about the future. History suggests that when consumer confidence is at exceedingly high levels, as it is today, the probability is that market returns will turn negative within a year or two. John Templeton described the phenomenon elegantly when he wrote: “Bull markets are born on pessimism, grown on skepticism, mature on optimism, and die on euphoria.”
Portfolio positioning
Given the recent outperformance of US stocks relative to international stocks and our expectation that this will continue, at least in the near-term, investors may consider tilting their global equity exposure to the U.S. more than a market-cap weighting would indicate. While the exposure of international stocks to foreign currencies makes forecasting relative performance a challenge, we believe a US bias in global equity portfolios has become a more acceptable risk than it has been in the past. The reason for this is that the relationship between the returns of international and US stocks has evolved and now exhibit a relatively strong, sustained, positive relationship that can be traced back to the fact that although US stocks and the US dollar used to move independently of each other, more often than not, they now move in the same direction at the same time. While the foreign currency exposure of international equities no longer provides the same level of diversification with US equities as before, we still recommend some exposure to international equity markets. The reason for this is the increased directional coordination between these markets does not change the fact that the size of their respective moves may be materially different.
The current environment is also a good one to reinforce with investors that even though there is strong empirical support for the long-term efficacy of factor-based investing that over-weights stocks with attractive valuations, price momentum or some other characteristic, investors should be prepared, depending on the current market regime, to see their stock allocation significantly underperform or outperform broad-based indexes.
The probability that interest rates will continue rising suggests that bond investors will continue to face a headwind. High yield may continue to be the fixed income sector most protected from interest rate increases given that lower-quality credit tends to move in fairly close coordination with the US stock market. While fixed income alternatives that have an equity sensitivity will likely continue to outperform traditional investment-grade bond indexes, investors should not lose sight of the fact that the same equity sensitivity that adds return today may weigh on returns when equity prices are falling.
Finally, we remain supportive of a strategic allocation to managed futures strategies even when their performance on a standalone basis has been negative, as it has been recently. They are such efficient diversifiers that including them in a portfolio brings down volatility enough to free up money that would otherwise be allocated to bonds so that it can instead be allocated to stocks.
Conclusion
It is easier to predict what will happen next than it is to predict when it will happen. For this reason we emphasize well-diversified “all-weather” portfolios that in any given year are designed to have returns that are neither the lowest nor the highest available from the market, but which will provide long-term returns consistent with an individual’s financial objectives and short term returns that allow the investor to remain confident and disciplined. |