|
|
|
|
|
Second Quarter Market Review
|
|
Zoë Brunson, CFA
Senior Vice President, Investment Strategies
|
|
|
|
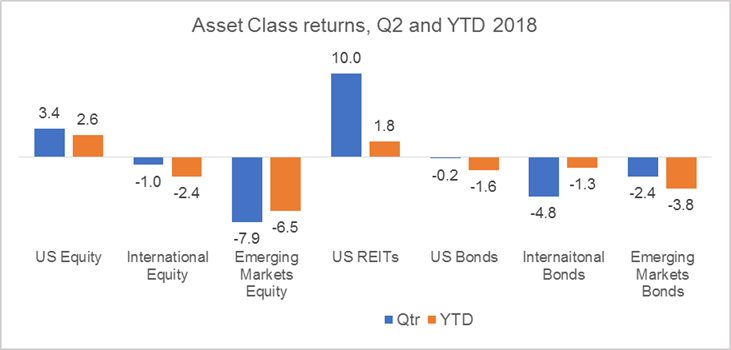
- The S&P 500 returned 3.4% in Q2, providing a year-to-date return of 2.6% for the period ending June 20181. The US markets were lifted by a robust earnings season with the number of companies beating estimates hitting record levels and economic data being better than expected.
- Smaller cap companies saw the strongest returns during the quarter with a return close to 8% for the Russell 2000 index2. The strong performance for small cap stocks helped their 3 and 5-year performance catch up with that of large caps stocks, which have consistently outperformed. In addition to the turnaround seen in small caps, there was also a turnaround with strong performance in dividend equities and REITs. US REITs was the best performing sector for the quarter, with a return of 10%, which lifted the year-to-date return into positive territory at 1.8%3.
 Source: Morningstar
- The US dollar reversed direction and rallied in the second quarter providing a powerful headwind to the performance of international equities held by US investors. Although the international developed equity markets outpaced the US markets (3.8% for MSCI EAFE compared to 3.4% for S&P 500) in local currency terms, international developed equity markets returned -1.0% in US dollar terms4. Having been a source of solace for equity investors in the first quarter, emerging markets tumbled in the second quarter with a return of -7.9% (MSCI Emerging Markets)5. All of the BRIC (Brazil, Russia, India and China) countries were in negative territory with Brazil seeing the largest loss with a return of -26.4% for the quarter6.
- The fixed income markets stayed in negative territory for the second quarter as central banks globally raised rates (U.S.) or stopped easing (European Central Bank). As seen in the last few quarters, the fluctuating value of the US dollar had a large impact on returns from international bonds for US investors. In the second quarter, the stronger dollar meant international bonds returned -4.8%, lagging the US markets at -0.2%7. The weakness seen in the second quarter for international bonds resulted in a year-to-date return of -1.3% for the period, slightly ahead that of US bonds at -1.6%8. Within the US bond market there was yield volatility with each end of the yield curve outperforming the belly. Short-term treasuries and long-term treasuries returned 0.5% and 0.3% respectively while intermediate-term treasuries returned 0.1%9. In the credit markets, investment grade corporate bonds returned -1.0% while high yield corporate bonds outperformed by 200 basis points with a return of 1.0%10. Year to date, the weakest fixed income sectors were long-term treasuries and investment grade corporate bonds with returns of -3.0% and -3.3%, respectively, while short-term treasuries provided the strongest returns at 0.8%.
|
|
Ask a question about Zoë's update »
View Q2 Market Update »
|
|
|
|
1 Morningstar
2 Ibid
3 Ibid
4 Ibid
5 Ibid
6 BRIC represented by MSCI BRIC INDEX (USD), Brazil represented by MSCI BRAZIL INDEX (USD). Source: Morningstar
7 International bonds represented by Bloomberg Barclays Global Aggregate ex U.S. US bonds represented by Bloomberg Barclays US Aggregate. Source: Morningstar
8 Ibid
9 Short-term treasuries represented by Bloomberg Barclays US Treasury 1-3 Year, long-term treasuries represented by Bloomberg Barclays US Treasury Long. Source: Morningstar
10 Investment grade corporate bonds represented by Bloomberg Barclays US Corporate, high yield corporate bonds represented by Bloomberg Barclays US Corporate High Yield. Source: Morningstar
|
| Asset Class |
Index |
Description |
| US Equities |
S&P 500 |
A cap-weighted index that is generally considered representative of the US equity market, consisting of 500 leading companies in leading industries of the U.S. Market capitalizations are generally above $5 billion representing approximately 80% of available market capitalization. |
| US Small Cap |
Russell 2000 |
An unmanaged index consisting of those companies considered to represent the small-cap segment of the US equity market. It is a subset of the Russell 3000 Index based on market capitalization. |
| International Developed Equity |
MSCI EAFE |
A free float-adjusted market capitalization-weighted index that is designed to measure the equity market performance of countries considered to represent developed markets, excluding the U.S. and Canada. |
| Emerging Markets Equity |
MSCI Emerging Markets |
A free float-adjusted market capitalization index that is designed to measure the equity market performance of countries considered to represent emerging markets. |
| US Fixed Income |
Bloomberg Barclays US Aggregate |
The index covers the USD-denominated, investment-grade, fixed-rate, taxable bond market of SEC-registered securities. The index includes bonds from the Treasury, Government-Related, Corporate, MBS (agency fixed-rate and hybrid ARM passthroughs), ABS, and CMBS sectors. U.S. Agency Hybrid Adjustable Rate Mortgage (ARM) securities were added to the U.S. Aggregate Index on April 1, 2007. |
| US High Yield |
Bloomberg Barclays US Corporate High Yield |
The index measures the market of USD-denominated, non-investment grade, fixed-rate, taxable corporate bonds. Securities are classified as high yield if the middle rating of Moody’s, Fitch, and S&P is Ba1/BB+/BB+ or below. The index excludes emerging market debt. |
| US Investment Grade Credit |
Bloomberg Barclays US Corporate |
The index is a broad-based benchmark that measures the investment grade, fixed-rate, taxable, corporate bond market. It includes USD-denominated securities publicly issued by U.S. and non-U.S. industrial, utility, and financial issuers that meet specified maturity, liquidity, and quality requirements. |
| US Short Treasuries |
Bloomberg Barclays US Treasury 1-3 Year |
The index measures the performance of short term government bonds issued by the US Treasury. It includes all publicly issued, US Treasury securities that have a remaining maturity of between 1 and 3 years, are non-convertible, are denominated in US dollars, are rated investment grade, are fixed rate, and have $250 million or more of outstanding face value. |
| US Long Treasuries |
Bloomberg Barclays US Treasury Long |
The index measures the performance of long term government bonds issued by the US Treasury. It includes all publicly issued, US Treasury securities that have a remaining maturity of 10 or more years, are non-convertible, are denominated in US dollars, are rated investment grade, are fixed rate, and have $250 million or more of outstanding face value. |
| International Fixed Income |
Bloomberg Barclays Global Aggregate ex US |
The index is a measure of global investment grade debt from twenty-three local currency markets. This multi-currency benchmark includes government-related, corporate and securitized fixed-rate bonds from both developed and emerging markets issuers. The index also includes Eurodollar, Euro-Yen, and 144A Index-eligible securities, and debt from five local currency markets not tracked by the regional aggregate benchmarks (CLP, MXN, ZAR, ILS and TRY). |
| US Real Estate |
Dow Jones US Select REIT Index |
A broad measure of the performance of publicly traded US real estate securities, such as Real Estate Investment Trusts (REITs) and REIT-like securities. |
| BRIC |
MSCI BRIC Index (USD) |
The MSCI BRIC Index is a free float-adjusted market capitalization weighted index that is designed to measure the equity market performance across the following 4 Emerging Markets country indexes: Brazil, Russia, India and China. With 307 constituents, the index covers approximately 85% of the free float-adjusted market capitalization in each country. |
| Brazil |
MSCI BRAZIL Index (USD) |
The MSCI Brazil Index is designed to measure the performance of the large and mid-cap segments of the Brazilian market. With 53 constituents, the index covers about 85% of the Brazilian equity universe. |
|
|
This report is for informational purposes only, and is not a solicitation, and should not be considered investment advice. The information in this report has been drawn from sources AssetMark believes to be reliable, but its accuracy is not guaranteed, and is subject to change. Investors seeking more information should contact their financial advisor. Financial advisors may seek more information by contacting AssetMark at 800-664-5345.
Investing involves risk, including the possible loss of principal. Past performance does not guarantee future results. Asset allocation cannot eliminate the risk of fluctuating prices and uncertain returns. There is no guarantee that a diversified portfolio will outperform a non-diversified portfolio in any given market environment. No investment strategy, such as asset allocation, can guarantee a profit or protect against loss in periods of declining values. It is not possible to invest directly in an index.
Investments in mutual funds and exchange traded funds that hold equities, bonds, and other securities can decline significantly in response to adverse market conditions, company-specific events, changes in exchange rates, and domestic, international, economic, and political developments. Investments in bonds and fixed income related securities also involve market and interest rate risk (prices can decline, if interest rates increase), and default risk (an issuer being unable to repay principal and interest). High-yield bonds are generally subject to greater risk of default and volatility, than investment-grade bonds. Real estate investments are subject to credit and market risks, typically based on changes in interest rates and varied economic conditions. Investing in alternative investments, including managed futures, commodities, and currencies is not appropriate for all persons, as the risk of loss is substantial. Investments in futures involve market, counterparty, leverage, liquidity, interest rate, foreign currency, commodity, volatility, and other risks.
For more complete information about the various investment solutions available, including the investment objectives, risks and fees, please refer to the Disclosure Brochure and applicable Fund Prospectus. Please read them carefully before investing. For a copy, please visit www.assetmark.com, or contact your AssetMark Consultant or Financial Advisor.
CFA® and Chartered Financial Analyst® are registered trademarks owned by CFA Institute.
AssetMark, Inc. is an investment adviser registered with the Securities and Exchange Commission. Jason Thomas is also Chief Executive Officer & Chief Investment Officer of Savos Investments, a division of AssetMark, Inc.
©2018 AssetMark, Inc. All rights reserved.
For general public use.
|
|
|
|
|
|
|
C33023 | 07/2018 | EXP 09/30/2019
1041-7462 ADV
|
|
|
|